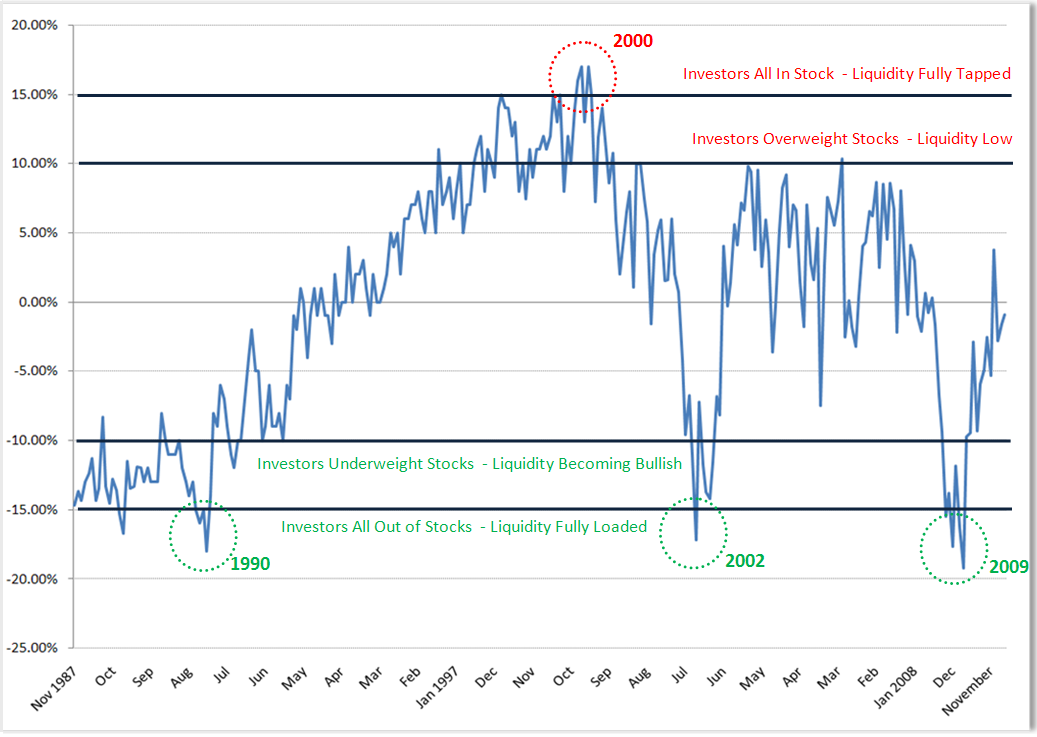
The chart below from the American Association of Individual Investors (AAII) shows the deviation from the mean by individual investor in regards to their historical stock allocation percentages.
Investor allocations to stocks is just back to the zero line, suggesting investors are only now back at their mean allocation to stocks. The 23 year mean by individual investors to stocks is 60%.
The fact that individual investors are not grossly over allocated to stocks at this point suggests they still have a fair amount of liquidity to invest. As long as liquidity remains favorable stocks should not experience any deep setbacks.
>
Equity Asset Allocation Deviation from Historical Mean

Chart courtesy of Fusion Investments


What's been said:
Discussions found on the web: