>
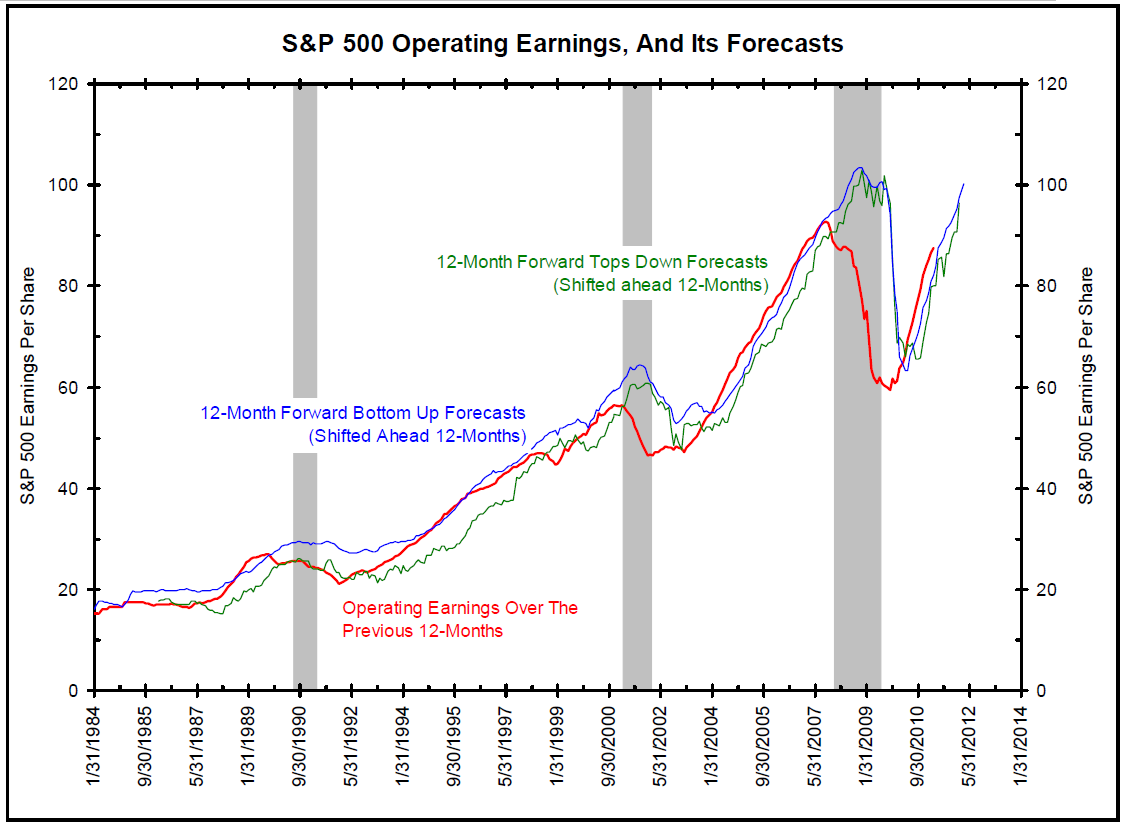
The chart above shows S&P operating earnings (red line) and their 12-month forward forecasts shifted ahead 12 months to the month they are predicted to happen. The second chart shows the difference between the forecasts and actual releases. The shaded areas highlight official recessions.
Wall Street is one of the few places where practice does not make perfect. Notice that every subsequent recession sees larger earnings error rates than the previous recession.
During the 1990/1991 recession, top-down forecasters (strategists) were too optimistic by 10%. Bottom-up forecasters (adding up the 500 company forecasts) were too optimistic by 25%.
During the 2000/2001 recession, top-down forecasters were too optimistic by 25%. Bottom-up forecasters were too optimistic by 23%.
During the 2007/2009 “Great Recession”, top-down forecasters were too optimistic by 39.6%. Bottom-up forecasters were too optimistic by 40%.
Also notice the difference between the top-down and bottom-up forecasts. Current strategists are getting significantly worse at predicting earnings than their 1980s and 1990s counterparts.
What Does This Mean?
If the economy goes into recession, earnings forecasts are not 10% to 12% too high. Instead they might be 20% to 40% too high. In other words,if the economy goes into recession, the earnings forecasts are horribly wrong. They might be so wrong that one can make the case that the market might be overvalued. We believe this is part of what is bothering the markets, the epiphany that the economy is much weaker than expected and a recession will blow a hole in earnings forecasts to the point that the market might not be cheap anymore.
>

Source: Bianco Research


What's been said:
Discussions found on the web: