The Billionaire Pessimists Club
Pardon the delay: I was planning on putting this up Tuesday, but I didn’t want to make this look like log rolling (after Tim...
 Last week, I showed a 50 year chart of the S&P500, focusing on the P/E over that time period. Today’s chart covers the same...
 We previously mentioned how Bullish the Pros were; What about the investing public — how Bullish are they? At least when measurd by...
 Light posting this weekend, but I came across two fascinating VIX graphs that demanded discussion. The VIX, for those of you who may not...
 As promised, today brings us to the 4th in our series of charts: P/E vs S&P500 click for larger chart courtesy of Mike Panzner, Rabo...
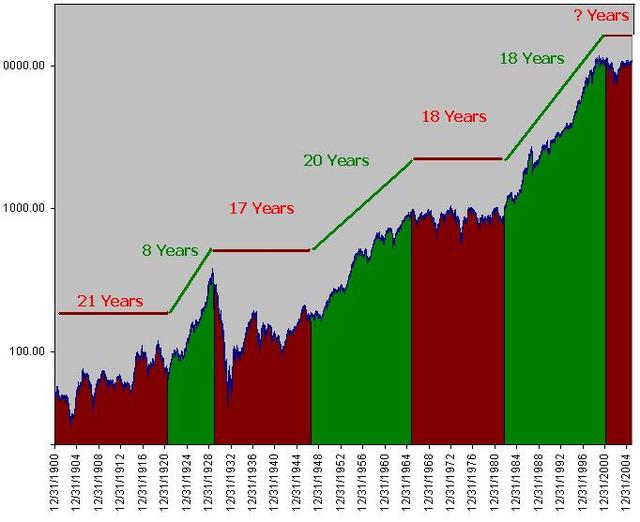
 Have a look at this 100 year (actually, 105-Year) chart. I colored each “Market” appropriately — Green for Bull, and...
 While everyone is busy unwrapping all of their holiday gifts, here’s something to mull over: Stuff doesn’t make you happy....
 The delightfully impish Doug Kass ("The Anti-Cramer") looks at the parallels between the 1994 tightening period and the...