 The # of Net 52 Week Highs (52 week highs minus lows) is barely positive, but as shown below, the strong bull market of 2003 produced...
Read More
 The chart below shows more aggressive downside trading activity on the NYSE. This oscillator tracks thrust sessions has moved below the...
Read More
 My earliest mentor in Technical Analysis was Guy Ortmann. He’s is a pure technician, and now works for Capital Growth Financial as...
Read More
 This weeks Barron’s has an interesting chart from Sy Harding. If you are unfamiliar with Harding’s work, have a look at his...
Read More
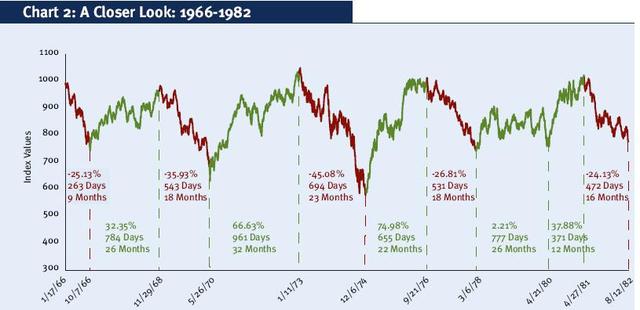 The previous chart reveals the long standing secular moves of the markets; What’s an investor to do during one of the long periods...
Read More
 The DOW and NASDAQ continue to make higher lows and the NASDAQ recently held critical support recently and bounced. Couple these near...
Read More
 The latest "Apprenticed Investor" column is up, and its called "The Stock Pre-Nup." Let’s assume you found a stock...
Read More
 I rarely disagree with with Mark Hulbert. He’s a longtime observer of the market and its players. Indeed, his tracking service...
Read More
 This weekend, we are in Chicago for a family event. After dinner (over Kir Royals), we discuss the economy, tax cuts and Oil. The subject...
Read More
I almost forgot! The latest "Apprenticed Investor" column is up, and its titled Six Keys to Stock Selection. By now,...
Read More
