
Recent Economic Developments, the Productive Potential of the Economy, and Monetary Policy
Governor Jerome H. Powell
Peterson Institute for International Economics, Wash, D.C., May 26, 2016
Thank you for the opportunity to speak here today. I will begin by reviewing recent economic developments and then turn to supply-side considerations, such as the level of potential output and the potential growth of our economy. I will conclude with a discussion of monetary policy. As always, the views I express here today are mine alone.
Recent Developments and the State of the Economy
The U.S. economy has improved steadily since the recovery began seven years ago. Our economy is now 10 percent larger than at its previous peak in 2007. Employment has surpassed its 2008 peak by 5 million workers, and the unemployment rate has fallen from 10 percent to 5 percent, close to the level that many observers associate with full employment.
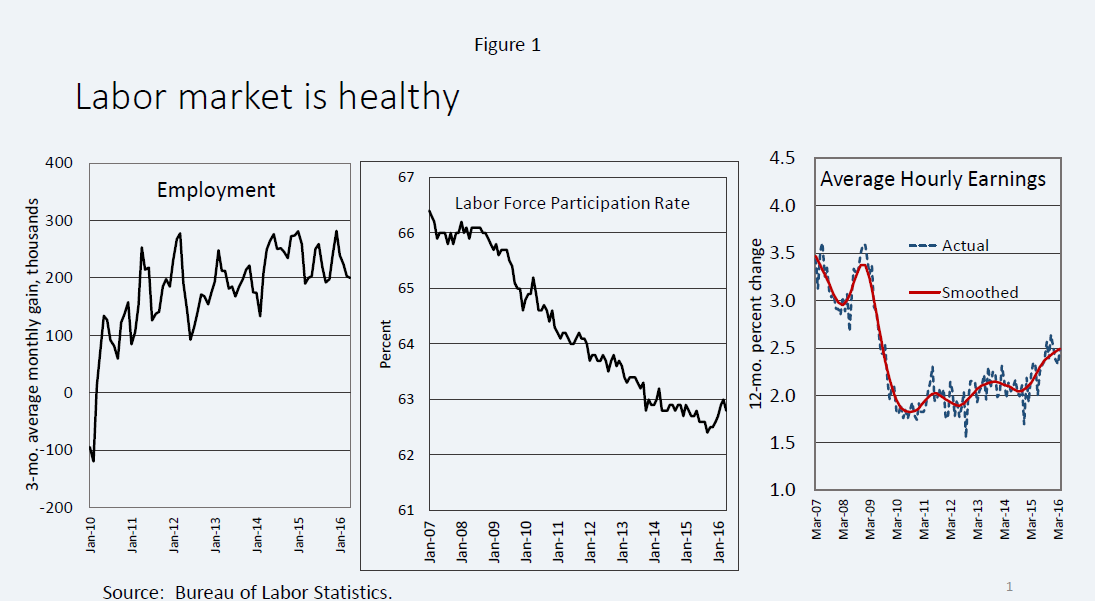
Labor market developments remain healthy, with employers adding roughly 200,000 jobs per month so far this year–a pace similar to that of the past several years (figure 1). Job growth continues to be substantially faster than the underlying growth of the labor force, so the labor market continues to tighten. Despite the strong job gains, the unemployment rate has flattened out at 5 percent over the past six months thanks to a welcome increase in the labor force participation rate. Meanwhile, there are tentative and encouraging signs of a firming in wages, seen most clearly in the data on average hourly earnings, which are rising faster than inflation and productivity. All told, labor market indicators show an economy on solid footing.
Recent spending data have been less positive than the labor market data. Growth of personal consumption slowed noticeably in the first quarter. Business fixed investment has fallen for two consecutive quarters, mainly because of a steep decline in energy-related capital expenditures. As a result, gross domestic product (GDP) growth over the two quarters ending in March 2016 is estimated to have averaged only 1 percent on an annualized basis. This estimate may continue to move around as more data come in.1And there are good reasons to think that underlying growth is stronger than these recent readings suggest. Labor market data generally provide a better real-time signal of the underlying pace of economic activity.2 In addition, retail sales surged in April, as did consumer confidence in May, suggesting that the pause in consumption may have been transitory. Moreover, stronger demand would be more consistent with an environment that remains quite supportive of growth, with low interest rates, low gasoline prices, solid real income gains, a high ratio of household wealth to income, healthy levels of business and household confidence, and continuing strong job creation. Indeed, current forecasts for second-quarter GDP growth are for a rebound to around 2-1/4 percent.3
Inflation remains below the 2 percent target of the Federal Open Market Committee (FOMC), with total inflation as measured by the price index for personal consumption expenditures at 3/4 percent over the 12 months ending in March and core inflation at 1-1/2 percent, both slightly higher than a year earlier. Core inflation has been held down by falling import prices, owing in large part to the rise in the dollar, as well as the indirect effects of lower oil prices on core prices. As the recent financial market tensions have eased, oil prices have increased and the dollar has weakened a bit on net. If oil prices and the dollar remain broadly stable, inflation should move up further over time to our 2 percent objective. Inflation expectations seem to be under some downward pressure. Some survey-based measures are at the low end of their recent historical ranges. Market-based measures of longer-term breakevens have declined significantly since mid-2014 and stand near all-time lows. While I see expectations as staying reasonably well anchored, it is essential that they remain so and that inflation return over time to the 2 percent objective.
The easing in global financial conditions since mid-February and the associated waning in downside risks are welcome, and in part reflect expectations that the FOMC would move more slowly in removing monetary accommodation. However, underlying risks will likely remain until global growth is on a stronger footing. Growth and inflation remain stubbornly low for most of our major trading partners. In China, stimulus measures should support growth in the near term but may also slow China’s necessary transition away from its export- and investment-led business model. Meanwhile, the ongoing buildup of debt there is notable. There is also some remaining uncertainty about China’s exchange rate policy. Elsewhere, risks are posed by the upcoming “Brexit” vote, ongoing pressures from refugee flows into Europe, and challenging conditions for emerging economies such as Brazil, Russia, and Venezuela.
Despite these downside risks, I see U.S. demand growing at a moderate pace, the labor market continuing to heal, and inflation returning over time to the FOMC’s 2 percent objective. The economy is on track to attain the Committee’s dual mandate of stable prices and maximum employment.
Supply-Side Considerations
For several years after the crisis, economic activity remained far below its potential, and the need for highly accommodative policy seemed clear. As the shortfall of output from potential has narrowed, supply-side considerations such as the level and growth rate of potential output naturally begin to matter more for policy. I will turn now to a discussion of these issues.
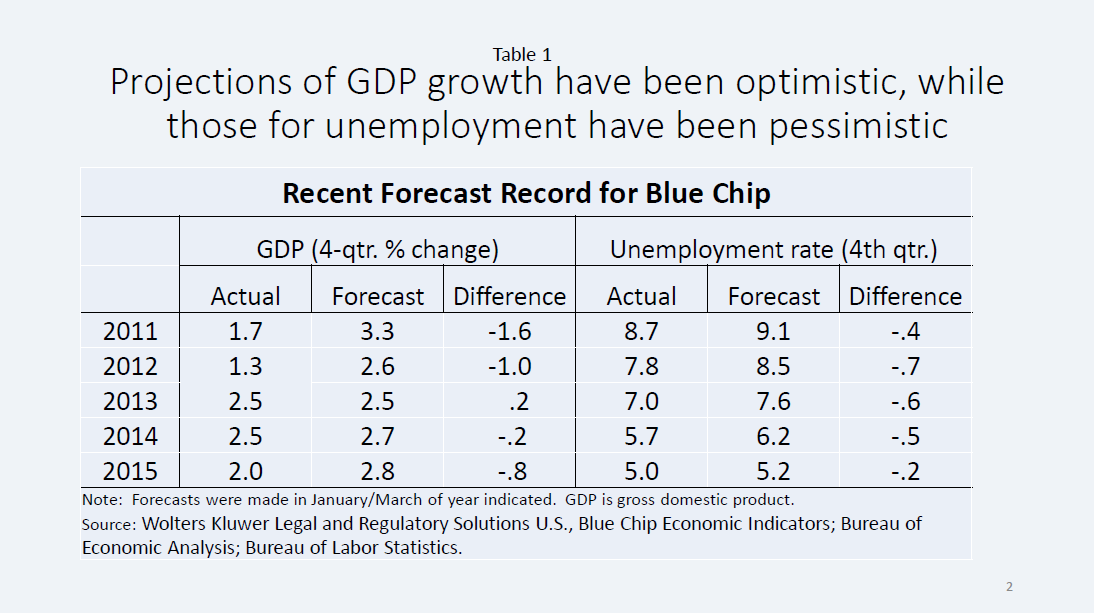
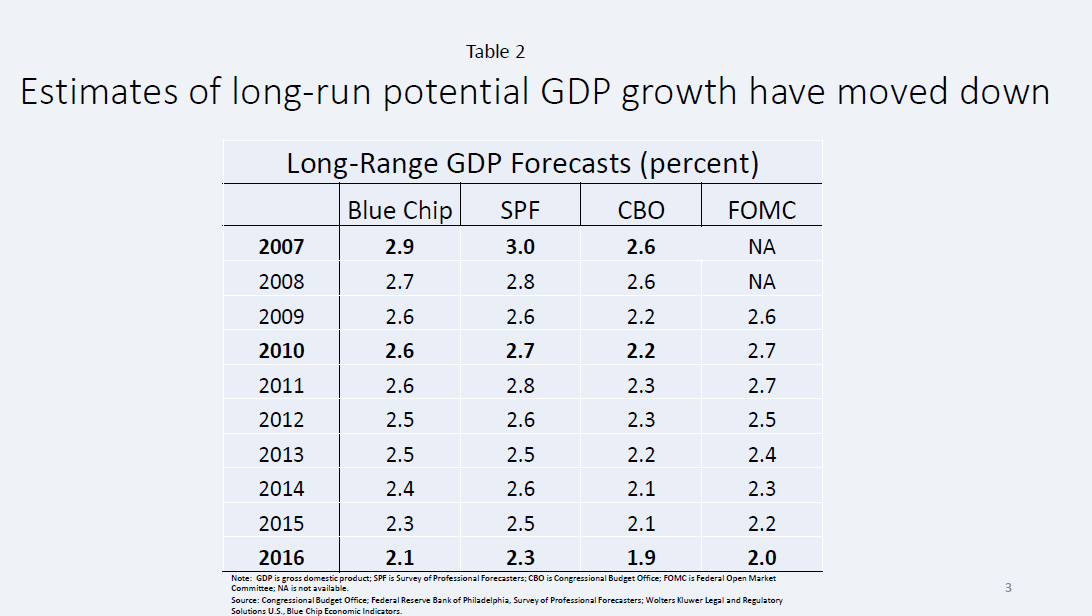
The tension between labor market and spending data is not a recent phenomenon. Throughout the recovery period, forecasters have consistently overestimated both actual and potential GDP growth while underestimating the rate of job creation and the pace of decline of the unemployment rate (table 1). For example, in 2007, the average expectation for long-run GDP growth from the Blue Chip survey of 50 forecasters was 2.9 percent (table 2). After successive reductions, the estimate now stands at 2.1 percent. Blue Chip forecasters also underestimated the decline in the unemployment rate. Other well-known forecasts followed this same pattern, including those of the Congressional Budget Office, the Survey of Professional Forecasters, and, yes, FOMC participants. The pattern suggests that forecasters have only gradually taken on board the decline in potential in the wake of the financial crisis.
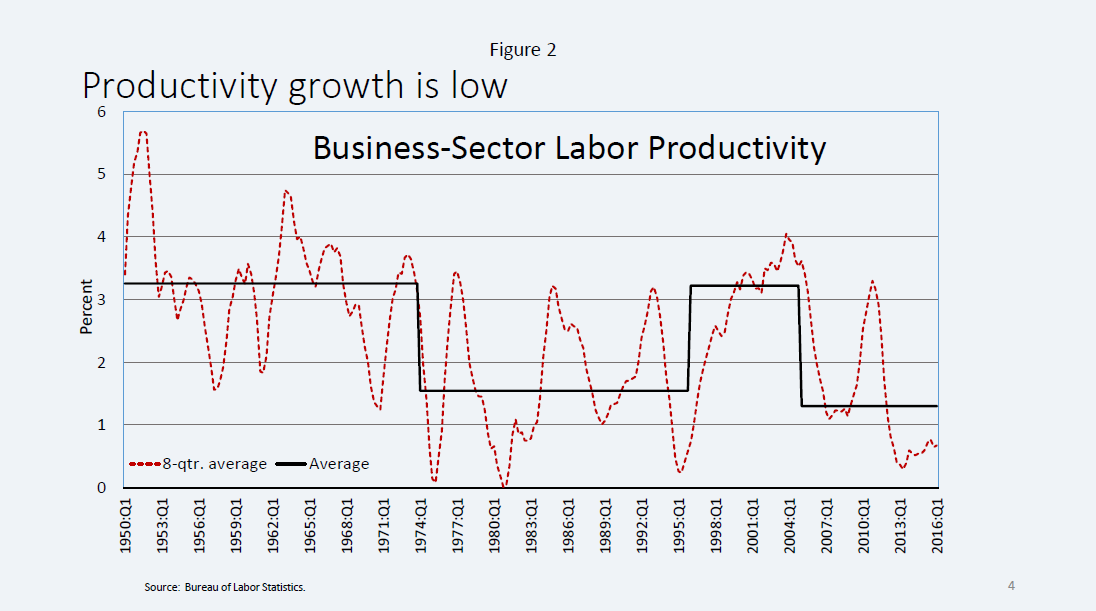
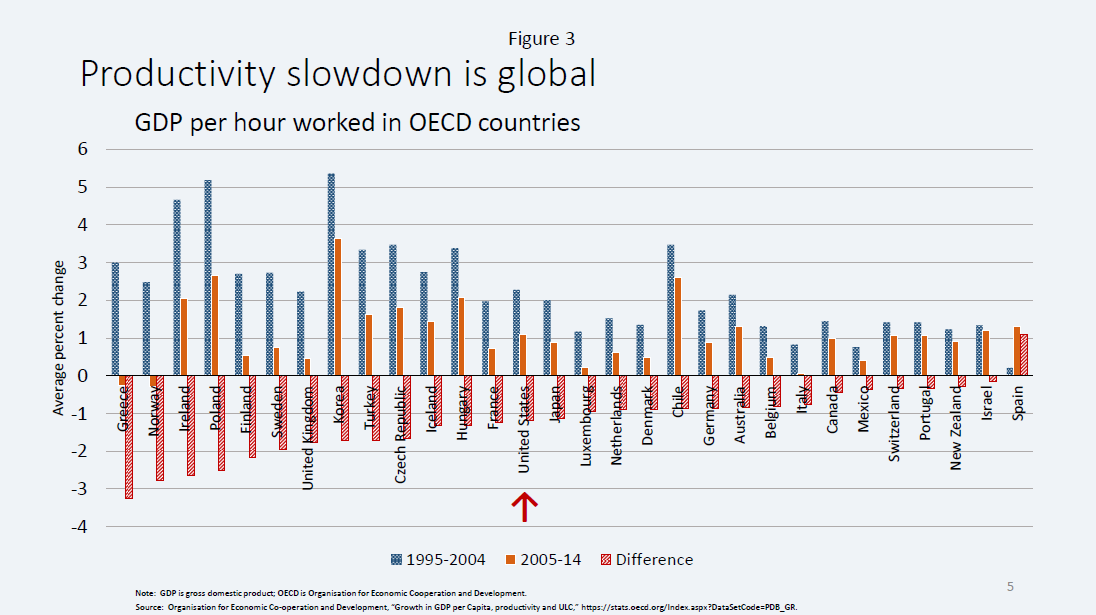
Output growth can be decomposed into increases in hours worked and changes in output per hour, or productivity growth. For the United States, much of the post-crisis decline in estimates of potential output growth appears to reflect weak labor productivity growth rather than damage to labor supply. Labor productivity has increased only 1/2 percent per year since 2010–the slowest five-year growth rate since World War II and about one-fourth of the average postwar rate (figure 2). For further perspective, productivity growth averaged 1-1/2 percent during the so-called slow productivity period from 1974 to 1995 and 3 percent during the tech-boom decade from 1995 to 2005. The slowdown has been worldwide and is evident even in countries that were little affected by the crisis (figure 3). Given the global nature of the phenomenon, changes in factors specific to the United States are probably not the main drivers.
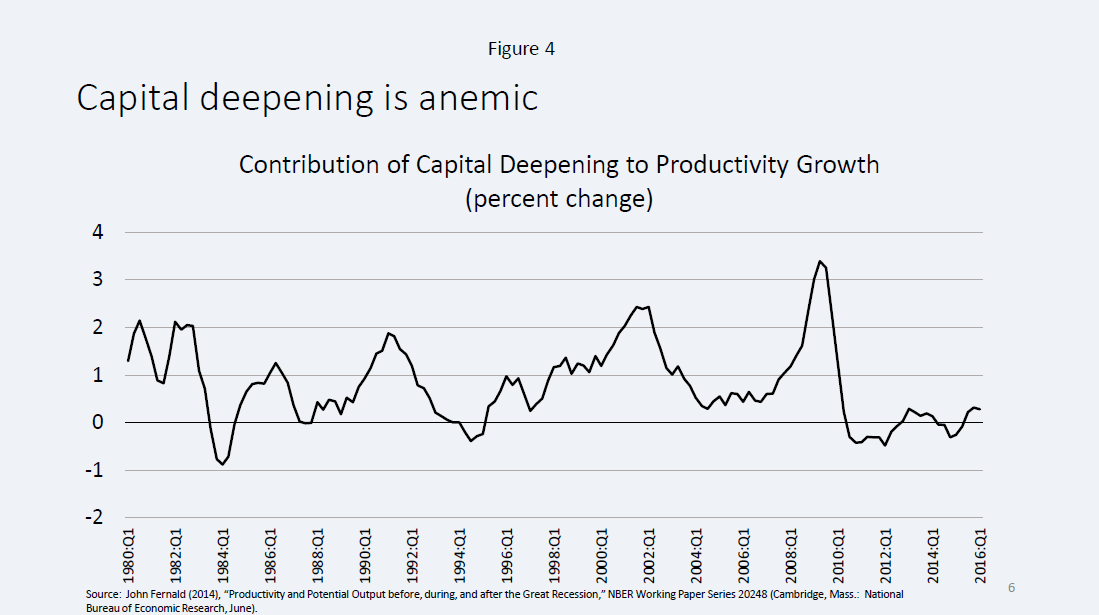
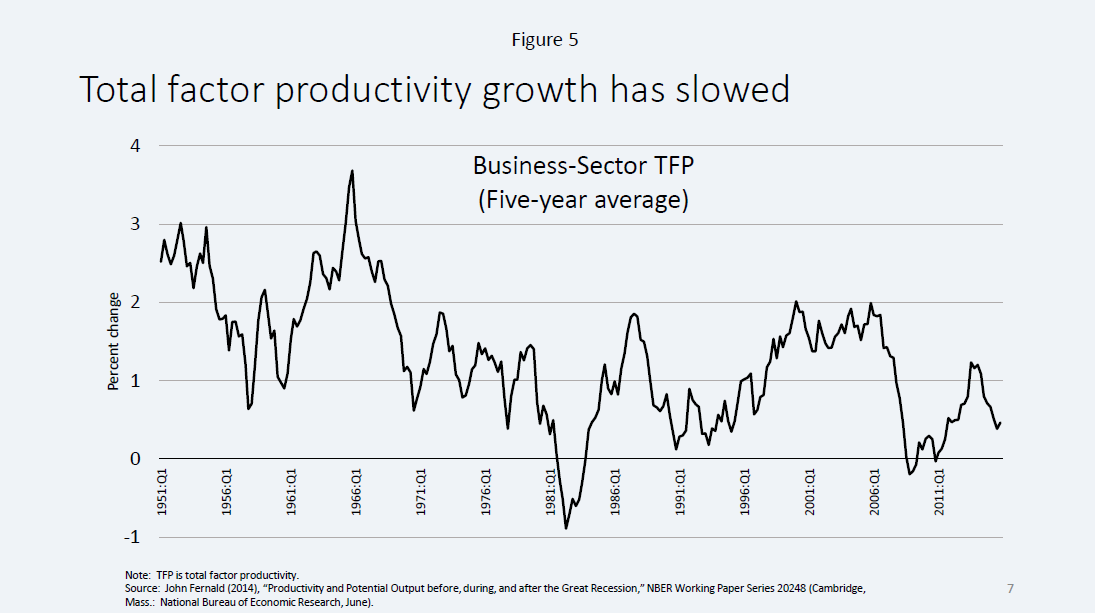
One factor holding back productivity in recent years has been the meager growth in the business sector’s capital stock (figure 4). This weakness is consistent with the weak recovery in demand.4 Another important factor is the marked decline in total factor productivity (TFP) growth (figure 5). TFP is that part of productivity that is not explained by capital investment or labor quality; it is thought to be mainly a function of technological innovation.5 A broad decline in the dynamism in our economy may also be contributing to lower TFP.6 There is strong evidence that the slowdown in TFP growth in the United States preceded the financial crisis, particularly in sectors that produce or use information technologies.7
The range of opinions on the future path of productivity growth is wide, and the historical record provides ample grounds for humility.8 A middle-ground position that seems to underlie many current forecasts is that productivity is probably still being held down by cyclical factors and lingering effects of the crisis. As those factors dissipate, labor productivity growth should move up to 1-1/2 percent or so, the lower end of its longer-run range.
In addition to productivity, the other principal factor in potential output is labor supply, which is determined by the working-age population, the natural rate of unemployment, and the trend labor force participation rate. Both the natural rate of unemployment and labor force participation initially appeared to suffer crisis-related damage. But more recent data are a bit more encouraging.
The natural rate of unemployment reflects the matching of characteristics that employers are seeking with those of the unemployed. With the dramatic labor market dislocations of the crisis, it was not surprising to see measures of matching efficiency deteriorate, and many observers raised their estimates of the natural rate accordingly. But there are other factors, such as demographic change, that may have led to a decline in the natural rate of unemployment.9 Blue Chip forecasters’ estimate of the natural rate have now returned to around 5 percent, about the same as before the crisis, suggesting that these factors are roughly offsetting. Of course, estimates of the natural rate are highly uncertain.10
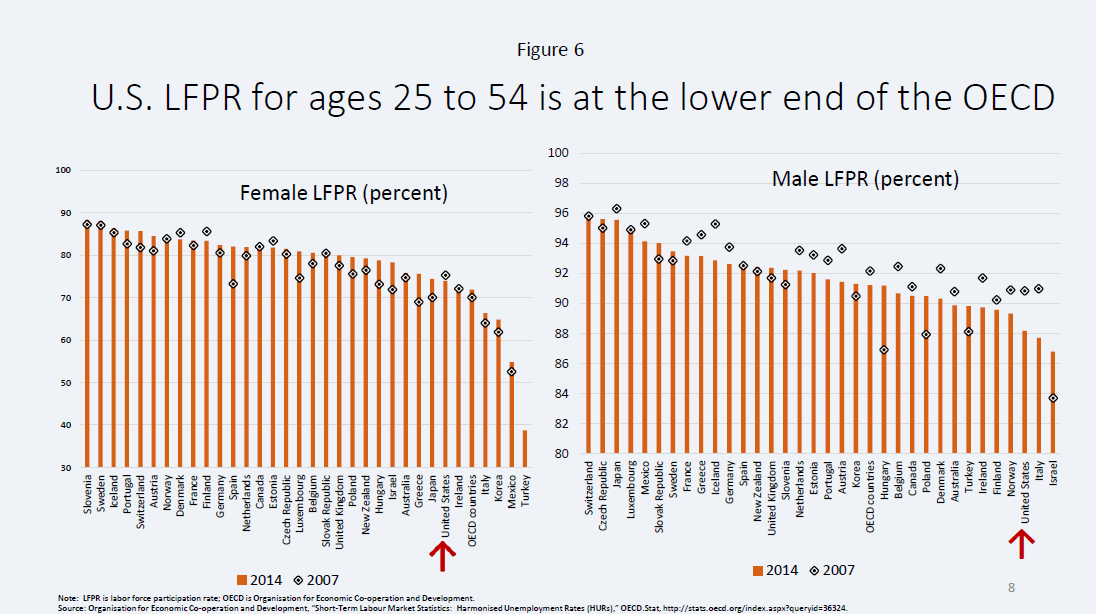
Trends in labor force participation add another element of uncertainty. Participation has been declining since about 2000 and is estimated to have a trend rate of decline of 20 to 30 basis points per year, driven by population aging and other longer-term trends such as the decline in participation by prime-age males. But the participation rate fell sharply after the crisis, faster than its apparent trend. It has been important to understand how much of the post-crisis decline is cyclical, and thus amenable to repair by supportive policies, and how much is secular, due either to longer-run trends or to irreversible crisis-related damage. It has been a relief to see the participation rate improve over the past two years relative to estimates of its trend; indeed, participation is now close to some such estimates.11 Still, despite this relative improvement, the performance of the U.S. economy on this dimension has been poor relative to that of most OECD (Organisation for Economic Co-operation and Development) countries. For example, in the prime-age group of 25 to 54, the United States experienced a 2 percentage point decline in labor force participation from 2007 to 2014, while most OECD countries saw an increase (figure 6). The United States now stands at the low end of labor force participation for both men and women in this age group–above Italy, but well below Germany, France, and Spain.12
Lower potential growth would likely translate into lower estimates of the level of interest rates necessary to sustain stable prices and full employment. Estimates of the long-run “neutral” federal funds rate have declined about 100 basis points since the end of the crisis. The real yield on the 10-year Treasury is currently close to zero, compared with around 2 percent in the mid-2000s. Some of the decline in longer-term rates is explained by lower estimates of potential growth, and some by other factors such as very low term premiums.
To sum up so far, estimates of long-run potential growth of the U.S. economy have dropped from about 3 percent to about 2 percent in the wake of the crisis, with much of the decline a function of slower productivity growth. The decline in realized productivity growth seems to be driven both by low capital investment that is well explained by weak demand and by lower TFP growth. Expectations of lower productivity growth going forward are more a function of slower gains in TFP. Lower potential output growth would mean that interest rates will remain below their pre-crisis levels even after the output gap is fully closed and inflation returns to 2 percent.
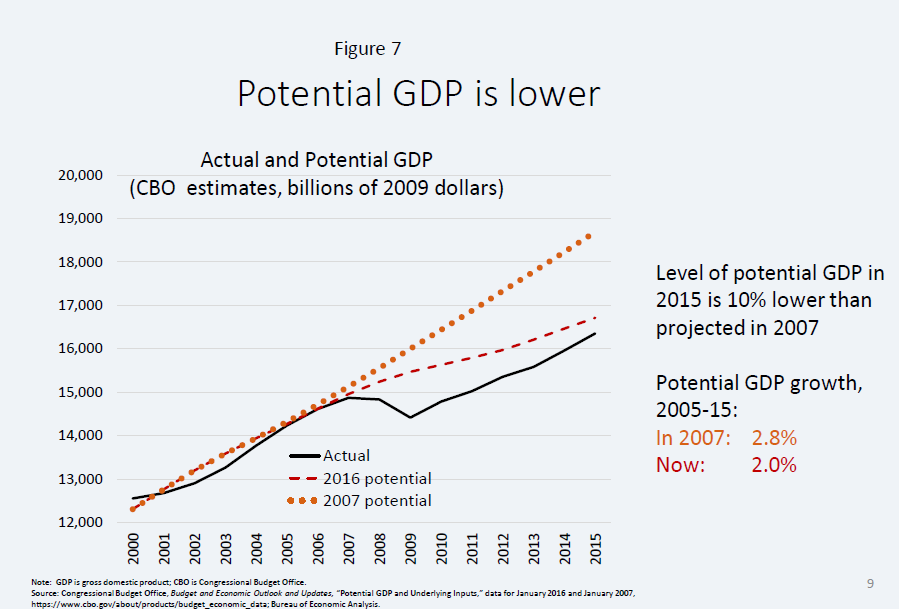
Over time, our understanding of the relationship between recessions and supply-side factors has evolved.13 There is a growing body of work suggesting that recessions can leave behind lasting damage–especially severe recessions associated with a financial crisis. One recent analysis suggests that about one-third of the time, there is no permanent supply-side damage; about one-third of the time, there is a reduction in the level of potential output but not its subsequent growth rate; and about one-third of the time, there is a reduction both in the level of output and in the growth rate.14 Unfortunately, recent experience suggests that the United States is at risk of falling in the last category (figure 7).
It goes without saying that economic policymakers should use all available tools to minimize supply-side damage from the crisis. We need policies that support labor force participation and the development of skills, business hiring and investment, and productivity growth–policies that are, for the most part, outside the remit of the Federal Reserve. Monetary policy can contribute by continuing to support the expansion as long as inflation remains consistent with our 2 percent objective and inflation expectations remain stable.
Strong labor markets do seem to be averting some of the damage that might otherwise have become permanent. Improved matching is reducing the natural rate of unemployment. Potential workers are being pulled into the labor force by rising real wages and the recognition that jobs are becoming easier to find. Over a longer period, stronger demand should support increased investment, driving productivity higher. Moreover, as the economy tightens, firms will have rising incentives to get more out of every dollar of capital and hour of work.
Real-time estimates of potential output are highly uncertain; forecasts of potential growth even more so. We can estimate growth of the working-age population reasonably well. Future levels of labor force participation are less certain. Least certain of all are forecasts of TFP. If the optimists are right, then there will eventually be another wave of high productivity growth driven by the truly remarkable evolution of technology. That would mean higher potential growth, faster increases in living standards, and also a return to higher interest rates over time.
What if the pessimists are right and productivity growth remains low for another decade, or indefinitely? The consequences would include lower potential growth and relatively lower living standards. Our longer-term fiscal challenges would be significantly greater.
Monetary Policy
The implications for monetary policy of these supply-side issues have been limited, but they begin to matter more as we near full employment.
For the near term, my baseline expectation is that our economy will continue on its path of growth at around 2 percent. To confirm that expectation, it will be important to see a significant strengthening in growth in the second quarter after the apparent softness of the past two quarters. To support this growth narrative, I also expect the ongoing healing process in labor markets to continue, with strong job growth, further reductions in headline unemployment and other measures of slack, and increases in wage inflation. As the economy tightens, I expect that inflation will continue to move over time to the Committee’s 2 percent objective.
If incoming data continue to support those expectations, I would see it as appropriate to continue to gradually raise the federal funds rate. Depending on the incoming data and the evolving risks, another rate increase may be appropriate fairly soon. Several factors suggest that the pace of rate increases should be gradual, including the asymmetry of risks at the zero lower bound, downside risks from weak global demand and geopolitical events, a lower long-run neutral federal funds rate, and the apparently elevated sensitivity of financial conditions to monetary policy. Uncertainty about the location of supply-side constraints provides another reason for gradualism.
There are potential concerns with such a gradual approach. It is possible that monetary policy could push resource utilization too high, and that inflation would move temporarily above target. In an era of anchored inflation expectations, undershooting the natural rate of unemployment should result in only a small and temporary increase in the inflation rate.15 But running the economy above its potential growth rate for an extended period could involve significant risks even if inflation does not move meaningfully above target. A long period of very low interest rates could lead to excessive risk-taking and, over time, to unsustainably high asset prices and credit growth. Macroprudential and other supervisory policies are designed to reduce both the likelihood of such an outcome and the severity of the consequences if it does occur. But it is not certain that these tools would prove adequate in a financial system in which much intermediation takes place outside the regulated banking sector. Thus, developments along these lines could ultimately present a difficult set of tradeoffs for monetary policy.16
Conclusion
To wrap up, with the support of monetary accommodation, our economy has made substantial progress. My view is that a continued gradual return to more normal monetary policy settings will give us the best chance to continue to make up lost ground.
1. For example, according to the Bureau of Economic Analysis, a 70 percent confidence band around the estimate of first-quarter GDP would extend from negative 0.7 percent to 1.7 percent, which implies that the spending data should be taken with a grain of salt.Return to text
2. Analysis by Board staff finds that lagged employment growth provides a better signal of current-quarter GDP or employment growth than does lagged GDP growth. Return to text
3. For example, the May Blue Chip forecast for second-quarter real GDP growth was 2.3 percent, and the Federal Reserve Bank of Atlanta’s GDPNow forecasting model predicted 2.5 percent, as of May 17. Return to text
4. See Eugenio Pinto and Stacey Tevlin (2014), “Perspectives on the Recent Weakness in Investment,” FEDS Notes (Washington: Board of Governors of the Federal Reserve System, November 21). Their analysis indicates that investment growth over the expansion has been consistent with a model using business output growth and the user cost of capital. In a second model, they show that the modest increases in the capital stock are consistent with the increase in labor supply and TFP. Return to text
5. Over long periods of time total factor productivity is primarily driven by innovation, knowledge and the efficiency with which inputs are put to use owing to the evolution of business practices as well as the influences of public capital stock, government regulations and other factors. Over shorter periods of time TFP will also capture the variations in the intensity of utilization of inputs, such as capacity utilization and hours per worker. Disentangling TFP from capital deepening and hours worked can be challenging.Return to text
6. See, for example, Ryan Decker, John Haltiwanger, Ron Jarmin, and Javier Miranda (2014), “The Role of Entrepreneurship in U.S. Job Creation and Economic Dynamism,”Journal of Economic Perspectives, vol. 28 (Summer), pp. 3-24. Return to text
7. See John Fernald (2014), “Productivity and Potential Output before, during, and after the Great Recession,” NBER Macroeconomics Annual, vol. 29, no. 1 (Cambridge, Mass.: National Bureau of Economic Research). Some have argued that part of the TFP slowdown may actually be a measurement problem, owing to the difficulty in measuring the productivity of health care, information technology, and other services. Others see the evidence for that claim as weak. For example, a recent paper finds little evidence that the slowdown arises from growing mismeasurement in information-technology-related goods and services. See David M. Byrne, John G. Fernald, and Marshall B. Reinsdorf (2016), “Does the United States Have a Productivity Slowdown or a Measurement Problem?”  Brookings Papers on Economic Activity, March 4. Return to text
8. On the pessimistic end of the spectrum are analysts such as Robert Gordon; among the optimists are Erik Brynjolfsson and Andrew McAfee. See Robert J. Gordon (2016), The Rise and Fall of American Growth: The U.S. Standard of Living since the Civil War(Princeton, N.J.: Princeton University Press); and Erik Brynjolfsson and Andrew McAfee (2014), The Second Machine Age: Work, Progress, and Prosperity in a Time of Brilliant Technologies (New York: W.W. Norton). Return to text
9. For example, older labor force cohorts have lower participation but also lower unemployment rates. Return to text
10. Confidence intervals around statistical estimates of the natural rate are routinely estimated to be quite wide, reflecting both uncertainty about the correct model specification and uncertainty about the parameter estimates given the model. The canonical paper by Staiger, Stock, and Watson puts the 95 percent confidence interval at 1-1/2 percentage points on either side of the point estimate. See Douglas Staiger, James H. Stock, and Mark W. Watson (1997), “How Precise Are Estimates of the Natural Rate of Unemployment?” in Christina D. Romer and David H. Romer, eds., Reducing Inflation: Motivation and Strategy (Chicago: University of Chicago Press). Return to text
11. For example, a paper by Stephanie Aaronson and others estimates a trend below the current participation rate, while the Congressional Budget Office’s estimate is above the current rate. See Stephanie Aaronson, Tomaz Cajner, Bruce Fallick, Felix Galbis-Reig, Christopher Smith, and William Wascher (2014), “Labor Force Participation: Recent Developments and Future Prospects,” Brookings Papers on Economic Activity, Fall, pp. 197-275; and Congressional Budget Office (2016), The Budget and Economic Outlook: 2016 to 2026 (Washington: CBO, January 25). For the argument that most of the decline is related to the severity of the recession and is likely reversible, see Christopher J. Erceg and Andrew T. Levin (2013), “Labor Force Participation and Monetary Policy in the Wake of the Great Recession (PDF),” IMF Working Paper WP/13/245 (Washington: International Monetary Fund, July). Return to text
12. Different countries use slightly different concepts for measuring labor force participation, and therefore cross-country comparisons may reflect some measurement issues. However, to the extent that these differences are constant over time, comparisons of the relative performances will be little affected. Accordingly, it is worth highlighting that the labor force participation rate in the 25-54 age group has declined somewhat in the U.S. since 2008, while it has been relatively steady or even increased some in other major advanced economies. Return to text
13. See, for example, Robert F. Martin, Teyanna Munyan, and Beth Anne Wilson (2014), “Potential Output and Recessions: Are We Fooling Ourselves?” IFDP Notes (Washington: Board of Governors of the Federal Reserve System, November 12); and Olivier Blanchard, Eugenio Cerutti, and Lawrence Summers (2015), “Inflation and Activity–Two Explorations and Their Monetary Policy Implications (PDF),” IMF Working Paper WP/15/230 (Washington: International Monetary Fund, November). Return to text
14. See Blanchard, Cerutti, and Summers, “Inflation and Activity,” in note 13. The authors argue that damage from recessions may be caused by hysteresis or by supply shocks such as oil price spikes or financial crises. In some cases, the link between recessions and future growth may reflect “reverse causation,” whereby the recession is caused by the realization that future growth will be lower than had been expected. Return to text
15. See, for example, Laurence Ball and Sandeep Mazumder (2011), “The Evolution of Inflation Dynamics and the Great Recession,” Brookings Papers on Economic Activity, (Spring), pp. 337–381; Blanchard, Cerutti, and Summers, “Inflation and Activity”, in note 13. Return to text
16. See for example, Jeremy C. Stein (2013), “Overheating in Credit Markets: Origins, Measurement, and Policy Responses.” Tobias Adrian and Adam B. Ashcraft (2012), “Shadow Banking Regulation” FRBNY Staff Report No. 559, and Samuel G. Hanson, Anil K. Kashyap, and Jeremy C. Stein (2011), “A Macroprudential Approach to Financial Regulation,” Journal of Economic Perspectives vol. 25, no. 1, both note that macroprudential tools may not be sufficient to fully address risks rising outside of the regulated banking sector. Return to text

