
Examining Changes in Labor Force Participation
Ellyn Terry,
Atlanta Federal Reserve, February 6, 2017
The Labor Department announced on Friday that January’s unemployment rate was 4.8 percent, only 10 basis points below the level in January 2016. You can be forgiven if looking at a graph of the unemployment rate since 2007 makes you think of a roller coaster, because it showed a very steep climb, followed by a swift decline. From a distance, it may seem like the car’s descent stopped about a year ago and has merely been bumping around a bit as it approaches the elevation of the platform.
But the unemployment rate alone does not fully account for improvement in the labor market. During the past three years, the labor force participation (LFP) rate has become a particularly important metric to look at. The overall share of the population that is working or actively seeking work has been essentially flat during this period, which is striking because there is a powerful demographic trend—an aging population—that is pulling it down with tremendous force.
Many factors are behind LFP’s relative flatness, some of which undoubtedly relate to the labor market’s strength. The opportunities available in the labor market affect an individual’s decision to enter or leave the labor force. For example, it can affect when a person chooses to retire, enroll in college, apply for disability insurance, or stay home to care for family instead of looking for employment.
On a quarterly basis we update our web page with analysis of how these reasons for not being in the labor market have changed during the past year, and we also look at the extent to which these changes affect the overall LFP rate. Between the fourth quarter of 2015 and the same period in 2016, the LFP rate rose 0.14 percentage points (not seasonally adjusted). The chart below breaks out this increase and shows how much the various reasons for nonparticipation account for the increase (holding the age composition of the population fixed) versus the downward pressure exerted by an aging population.
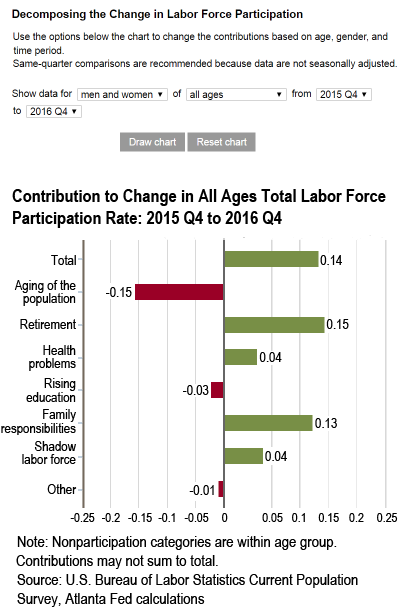
Let’s briefly look at the relative contributions to the change in labor force participation in more detail:
Aging of the population: During the last year, the aging population was the only significant factor continuing to depress the LFP rate. In line with this factor’s contribution from previous years, it accounted for about 0.15 percentage points of the decline in the LFP rate.
Retirement: Retirement rates ticked down over the year, resuming a trend that had stalled in the past few years. Later retirement was the largest influence on LFP in the past year and completely offset the effect of aging population, boosting the rate by 0.15 points.
Shadow labor force: The share of the population not technically counted as “unemployed” because they are not actively searching but say they want a job fell slightly over the past year. This decline boosted the LFP rate by 0.04 percentage points. (A decline in this category is usually associated with a strengthening labor market.)
Health problems: The share of the population who said they are too chronically ill or disabled to work declined for the second year in a row, reversing the trend of the prior eight years. This decline put upward pressure on LFP (0.04 percentage points) and could partly be a reflection of a stronger job market with more opportunities for those with disabilities (see this report ![]()
![]() from the U.S. Bureau of Labor Statistics for more information).
from the U.S. Bureau of Labor Statistics for more information).
Rising education: The share of the population not in the labor market because they are in school increased slightly, lowering the LFP rate by 0.03 percentage points. School enrollments rates rose for decades and accelerated during the last recession. The small contribution of schooling to the change in the LFP rate during the past year likely brings it closer to alignment with the long-term trend.
Family responsibilities: The share of the population not participating in the labor force because of family responsibilities declined during the last year, boosting the LFP rate by 0.13 percentage points.
An interactive chart on our website allows users to choose their own time period for comparison for all those 16 years old and above, those 25–54 years old, as well as for men and women separately. You can see how various factors have contributed to that roller coaster effect—strap yourself in!
~~~
 Ellyn Terry, an economic policy analysis specialist in the Atlanta Fed’s research department
February 6, 2017
