
Source: Calculated Risk
I’ve shown this wonderfully informative chart from Calculated Risk before, but its a worthwhile reminder that sometimes, the standard line price or volume charts are not the most informative ways to depict a data series.
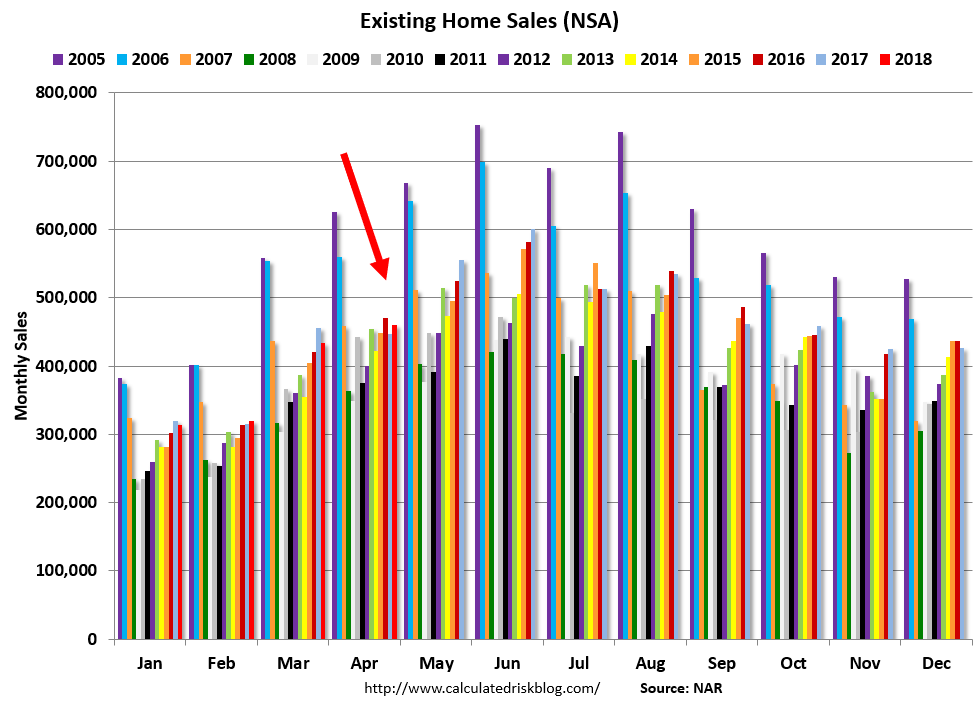
The above Existing Home Sales chart reveals two interesting issues: the first is the seasonality of residential real estate sales. They tend to bottom in December and January, rising to a peak in May June and July, as families with children want to get them into their new schools before the start of the academic year after summer.
Second, it also shows how far below we remain from the peak credit/RRE bubble of last decade. Not just a little below, but a solid 20 to 30% less volume than we saw in 2005. Last month was 460,000 units sold and closed; the peak in 2005 was well over 600,000 units.
That is a reminder just how out of whack the housing market became when free money and NINJA loans (no income no job or assets) ruled the day . . .
