
Labor Force Participation: The U.S. and Its Peers
Monday, June 22, 2015
By Maximiliano Dvorkin, Economist, and Hannah Shell, Research Associate
The U.S. labor market has changed drastically over the past 50 years. As the following figure shows, the U.S. labor force participation rate1rapidly increased starting in the mid-1960s, peaked around 2000 and fell substantially afterward.
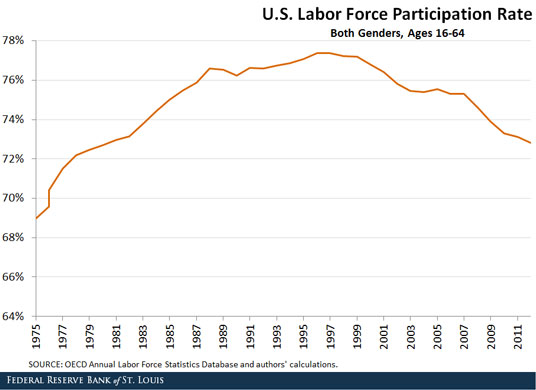
This trend is the result of many forces, some of them in opposition to each other. For example, male participation in the labor market has been steadily decreasing, while female participation increased drastically until 2000. In addition, the aging workforce and increasing number of youth pursuing higher education are also often cited as reasons for the recent decline in aggregate U.S. labor force participation.
These trends are not exclusive to the U.S. and reflect changes in social preferences for work and the pursuit of higher education across many countries. We compared labor force participation rates across eight developed countries since 1975 to better understand what is unique to the U.S. economy and what is not.2
Labor Force Participation and the Young
The first two figures below show the evolution of the labor force participation rates of men and women ages 15-24. In both figures, the trends across countries are clear: Labor force participation of both young men and women has been declining.
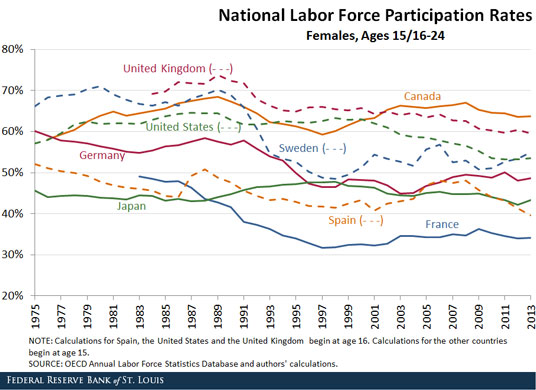
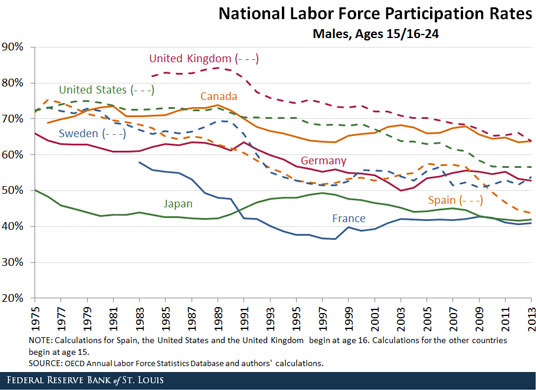
Over the period 1995-2013, the average decline in youth labor force participation across the eight countries and both sexes was 3.5 percentage points. The decline was largest in the U.S., where the portion of youth in the labor force decreased 11.2 percentage points, followed by the U.K. at 7.9 percentage points. As has been previously discussed, one of the main reasons for a decline in youth labor force participation is increased education. From 1995 to 2012, the enrollment rate of 15-24 year olds increased an average of 6.3 percentage points across countries in our sample.
Labor Force Participation and Prime-Age Workers
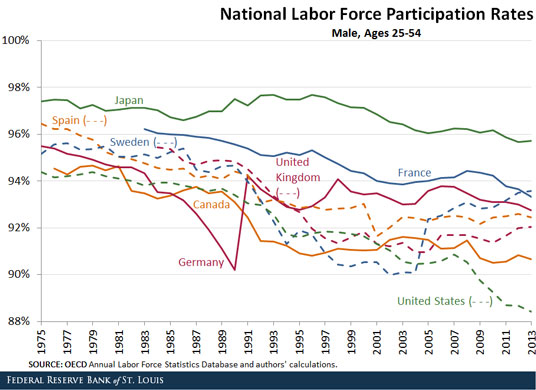
Prime-age workers are defined as workers from 25 to 54. The trends in labor force participation for women and men are very different across this age group, as seen in the figures below.
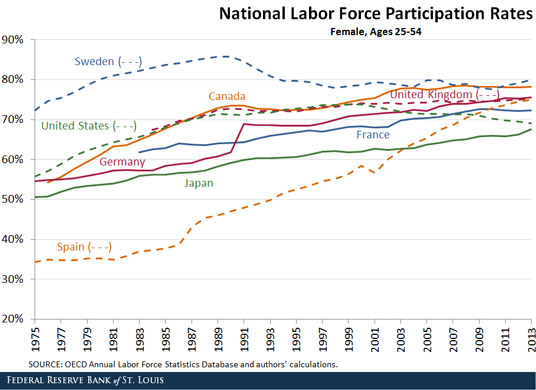
Across most countries, the share of women in the labor force has been rapidly increasing. More recently, though, this share has remained fairly constant and even decreased a little in the U.S. and Sweden. The U.S. used to have one of the highest female labor force participation rates in this age group compared to the other countries, but now has one of the lowest rates.
Contrary to women, labor force participation of prime-age males has been falling in most countries. The fall was particularly rapid in the U.S., where prime-age male labor force participation is the lowest in our sample.
Labor Force Participation and Older Workers
The labor force participation rates of workers close to retirement—those between 55 and 64—display different trends over time.
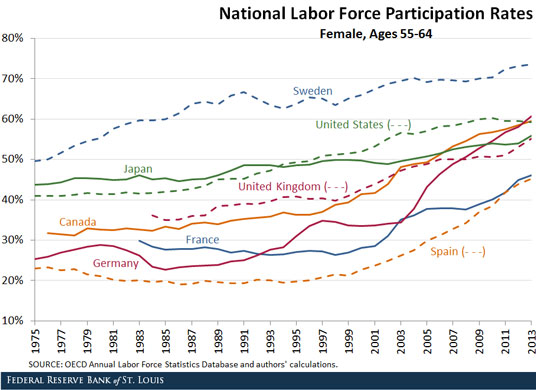
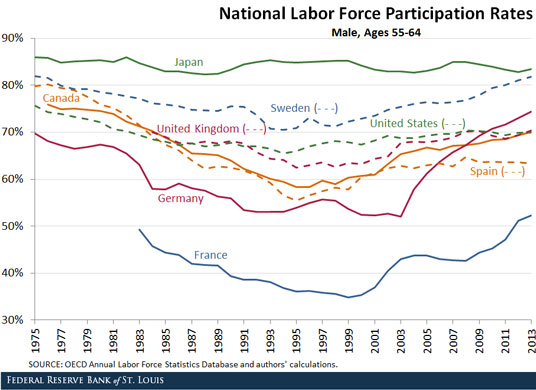
Labor force participation generally decreased among males until the mid-1990s, but has since trended up. Contrary to men, the labor force participation rate of women has been increasing throughout our sample. The increase in participation of women for this age group is mostly explained by women entering the work force at earlier ages and staying.
Overall, the average increase in pre-retirement participation from 2000 to 2013 was 11.8 percentage points. Germany and France experienced the largest increases, at 24.4 and 17.4 percentage points, respectively. The U.S. increased only 5.1 percentage points, the slowest pace next to Japan.
Conclusion
Despite the similar trends in youth, prime-age and pre-retirement participation rates, the U.S. is the only country in our sample experiencing a recent decline in the aggregate labor force participation rate. This is explained mostly by a larger-than-average drop in the labor force participation of prime-age males, a decrease in the participation of prime-age women and a lower-than-average increase in the participation of pre-retirement-age workers in the U.S. economy. Aging also played a role, as the share of the population between ages 25 to 54 (the group with the highest level of labor force participation) experienced a larger-than-average drop.
Notes and References
1 The labor force participation rate is calculated as the fraction of people ages 15 and above that are either employed or unemployed.
2 The other countries included in this analysis are Sweden, Japan, Canada, Germany, France, Spain and the United Kingdom. Because countries employ different definitions of labor market variables or use different statistical methods, we used data from the Organization for Economic Cooperation and Development, which are adjusted to facilitate cross-country comparison.
Additional Resources
- On the Economy: Living Arrangements, Labor Force Participation and Income
- On the Economy: Why Did Labor Force Participation by Youth Drop?
- On the Economy: How Should Labor Productivity Be Measured?
