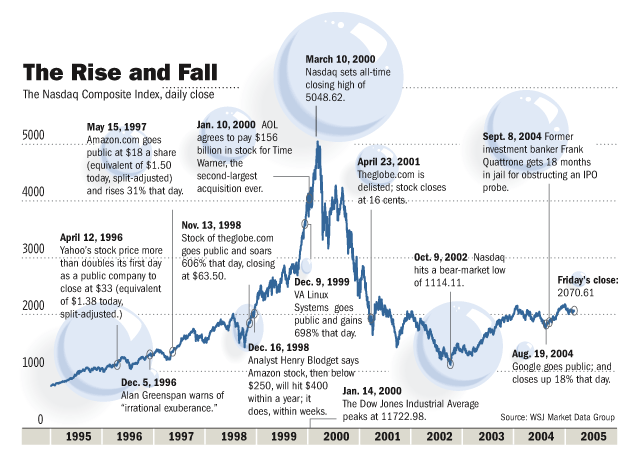
Today is the 5th Anniversary of the Nasdaq’s peak — 5048.62 on March 10, 2000 on a closing basis (The Nazz actually hit 5132 intraday).
Let’s do a little “compare and contrast” with Nasdaq, and other previous bubbles. Recall we visited this theme in Three Bubbles exactly one year ago (graphic). The goal is to merely consider some possible scenarios, so as to not get caught in mental boxes of our own making.
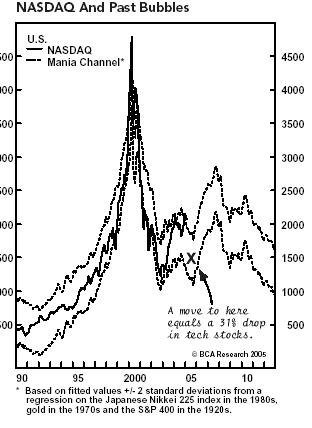
Now compare these with this chart from Charles Nenner of Cycle Forecaster BCA Research:
Good News/Bad News
Assuming the Nasdaq stays in the historical “Mania Channel” of past bubbles — an admittedly big “If” — the pattern suggests that a potential move downwards (late 2005/early 2006) of as much as 25 – 33% is quite possible.
And that’s not even the bad news (we’ll get to that later). The good news is that from those lows, the Nasdaq could potentially double, rising up to nearly 3,000 late in 2007; The bad news (you knew it was coming) is that from those dizzying heights, the down side is horrific: The chart suggests we may visit, if not surpass, the post-bubble lows.
That is, according to the historical composite of previous bubbles. That does not mean this is a sure thing, or even a likely outcome. Rather, it is merely one way of amalgamating prior data into a possible scenario.
I use these sorts of charts to help map out a worst case scenario.In my mind, I want to keep a visual of what could happen, what might occur. These gloom and doom exercises help traders imagine horrific crashes.
Hope for the best, but be prepared (mentally) the worst . . .
>
UPDATE March 10, 2005 6:15am
Dave Callaway compares Oil with the Nasdaq Bubble of 2000 (Double bubble oil and trouble); As I said on Squawk last week, and again here on Tuesday: You’ll know when Oil starts to get “stupid.”
We’re almost (but not quite) there. The pundits who all said oil was unsustainable at $40 ($15 terror premium and all that) have been replaced by those calling for $80 crude; I can’t tell you if they are the same T-heads.
Happy anniversary . . .
>
Sources:
Nasdaq and Past Bubbles
Charles Nenner, Cycle Forecaster
Memories of Nasdaq’s High
As Dow Flirts With 11,000, Technology Stocks Also Stir But Far From the Bubble Days
By E.S. BROWNING
THE WALL STREET JOURNAL, March 7, 2005; Page C1
http://online.wsj.com/article/0,,SB110995029690370706,00.html


Oil starts to get stupid when pundits lump it in with coffee, coal and cotton and all the other commodities, touting one big commodity boom. That’s when we are smack dab in the middle of another dot.com-oddity boom. Did you see all the commodity news on CNBC and Fox lately? I think we’re there. And on the issue of bubble comparisons, Didier Sornette at UCLA followed the S&P “after the crash” and postulated certain post crash “anti-bubble” behaviour based on the Nikkie crash. See: http://www.ess.ucla.edu/faculty/sornette/prediction/20041117.asp#prediction Ultimately he gave it up as a non-goer: See: http://www.ess.ucla.edu/faculty/sornette/prediction/index.asp
Google P/E = 119
ExxonMobil P/E = 15
That looks like another tech bubble forming, not a commodity bubble.
The difference between oil and technology is that it is possible for the oil supply to become permanently physically constrained. When production can no longer increase but demand still grows (e.g. China, India, etc), prices will increase permanently. That’s when the rule “everything that goes up must come down” no longer applies.
Shurely a regression of the NASDAQ index on the Nikkei is a spurious regression of two nonstationary series? I mean, the general idea of drawing the two charts together seems to be an interesting thing to do, but turning it into a linear regression doesn’t add anything.
On oil, I’d note that a 15% depreciation of $/EUR plus an unchanged EUR price of oil would give you $60 oil right out the box. The commodities “bubble”, IMO has been much more about dollars getting cheaper than commodities getting more expensive.
Carnival of the Capitalists Arrives
Welcome to the March 14, 2005 edition of Carnival of the Capitalists, the Internet’s most intriguing weekly round-up of free-market articles. We have some superb entries this week, and all are well worth reading. Affiliate Recruiting Blog – Franklin Ba…
Carnival of the Capitalists Arrives
Welcome to the March 14, 2005 edition of Carnival of the Capitalists, the Internet’s most intriguing weekly round-up of free-market articles. We have some superb entries this week, and all are well worth reading. Affiliate Recruiting Blog – Franklin Ba…
The bulls are coming out of the woodwork and predicting ever higher price targets. The highest I’ve seen so far is $100, courtesy of Stephen Leeb, who was quoted in the Daily News:
http://www.energybulletin.net/4731.html