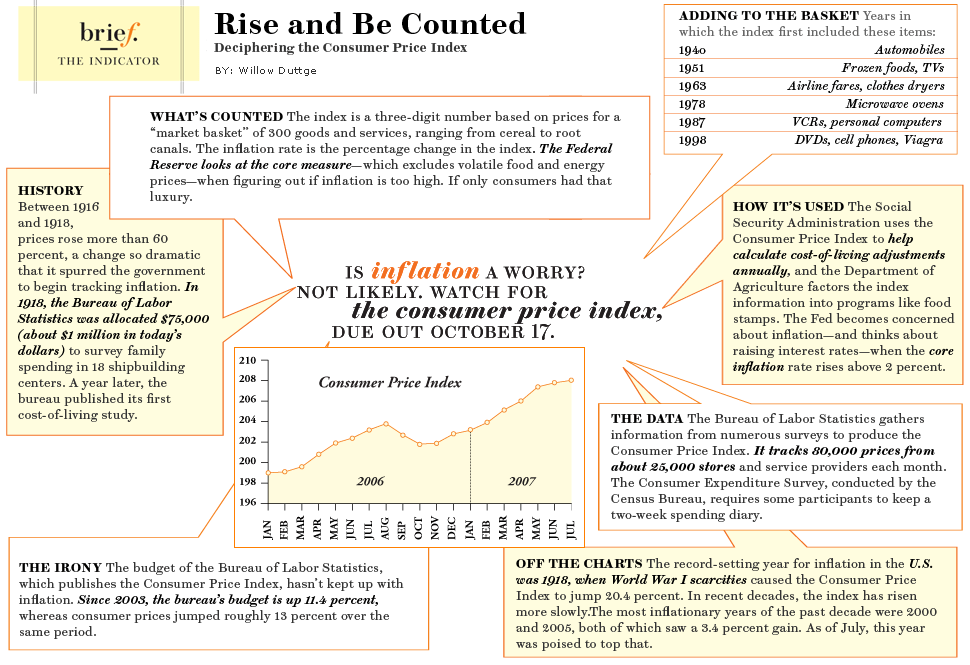
Yesterday, we noted how the CPI has diverged from reality (CPI Inflation Data is a “Lie”).
Today, I wanted to direct your attention to this great piece of info-porn on CPI, via Portfolio’s Willow Duttge. Methinks she goes too easy on BLS, but then again, I say that about just about everyone but John Williams.
>
click for a truly enormous graphic
graphic courtesy of Portfolio.com
>
>
Source:
Rise and Be Counted
Willow Duttge
Portfolio, October 2007
http://www.portfolio.com/news-markets/national-news/portfolio/2007/09/17/Consumer-Price-Index


If you look at John Williams’s CPI chart (third chart down) here:
http://www.shadowstats.com/cgi-bin/sgs/data
just imagine what the following chart would look like — if you plot the cumulative difference between his SGS CPI (blue line) and the reported CPI (red line), the resulting top line would be taking off at a good rate of rise.
To put it another way, the growing disparity between the reported figure and his projected CPI, which look somewhat parallel from year to year, would actually show an amazing rate of rise since 1990 if graphed cumulatively IMO.
Thus, the commonly shared perception that things really are much more expensive from day to day, or year to year. No, we are not making this feeling up.
Remember The Golden Rule — “He who has the gold makes the rule!”
A sexual dysfunction drug (getting around the spam filter here) is a component of CPI?
What genius thought that one up? They won’t add actual home purchase prices (largest cost component for the average household), but they will load it up with a gimmicky pharm and home consumer tech like VCRs, DVDs, PCs and cell phones all guaranteed to fall in price over the next 20 years with technology advances, particularly from Moore’s Law.
John Williams makes the comment
In general, if a government economic measure does [not] match common public experience, it has little use outside of academia or the spin-doctoring rooms of the Fed and Wall Street.
What use do government measures that do match common public experience have outside of Academia, the Fed and Wall Street?
I mean are a lot of people taking the BLS report to bed with them tonight? I thought that stuff was for us?
They won’t add actual home purchase prices (largest cost component for the average household)
What family do you know that purchases a new home every year? Home values do not effect mortgage payments.
Next you will be showing more financial porn like the FASB Level I, II and III Regs. It must be great to have so many Levels just like a Blockbuster Movie and it’s sequels.
Aside from my hay meadow, I own several puny commercial buildings in Dallas. My costs are generally insurance, taxes and researves for replacement of roofs etc. We began writing our leases with CPI escalators based on the pre Clinton changes several years ago. These are very similar to John Williams calculations. We adjust the Dallas Fed numbers through our accountant who has the program to do this. I suggest all you rent property owners do the same since the new roof you will no doubt need to replace someday will cost you FAR more than you think or have researved for.
Looking foreward to my 2.8% Social Security increase next year.
“Today, I wanted to direct your attention to this great piece of info-porn on CPI, via Portfolio’s Willow Duttge. Methinks she goes too easy on BLS, but then again, I say that about just about everyone but John Williams.”
Barry, we have taken the Red Pill, and now we strive to see what lies beneath. The bigger question for all of us is, “why does this Govt. now feel compelled to lie to it’s own citizens regarding our Treasury or lack thereof?”. How very far we have fallen, and in more important ways than mere finance.
Plus M2 continues to rise. Look at the latest release and check the monthly and weekly percentage increases (depending on the time scale look-back) of 5-7%:
http://www.federalreserve.gov/releases/h6/Current/
Check John Williams’s M3 series (link in previous post) which should be updated soon to show another rise most likely.