It has long been my perspective that following the great crash of 2000, we would be stuck in a secular bear market, with cyclical rallies and sell offs.
The lows set in October 2002/March 2003, up until the October 2007 highs, was an example of a cyclical rally. The selloff from October 2007 has been a cyclical bear within the larger context of a secular bear.
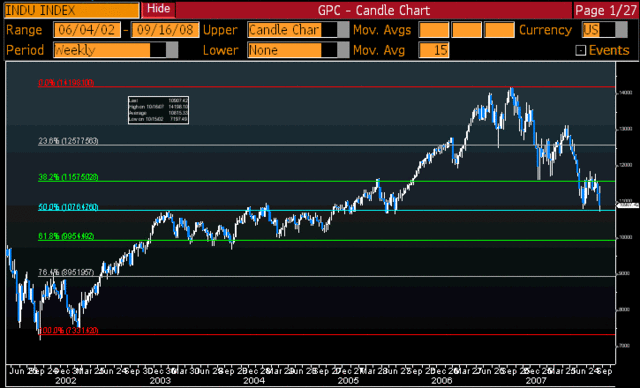
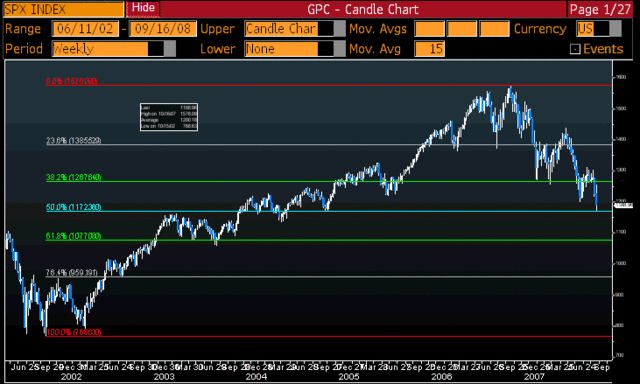
As of today, we have retraced exactly half of the gains from the 2002/03 lows up to the 2007 highs.
Given how horrific the news flow is, the general psychology is very negative. Not nearly enough to create a lasting low, but certainly enough to generate an interesting bounce.
That 50% retrace is where one would expect to see some sort of *rally. I don’t expect it to last very long, and its really a long term selling opportunity, but those with aggressive short positions should consider hedging those positions. I can understand not wanting to cover, given the dislocation of a potential AIG failure would cause. But at this point, the spring has been wound pretty tight.
* Be aware that I tend to be early, and that active traders should always scale in.
>
Dow Industrial Average, Weekly (2002-08)
click for larger chart
>
S&P500, Weekly (2002-08)
click for larger chart
Charts courtesy of FusionIQ, Bloomberg
>


What's been said:
Discussions found on the web: