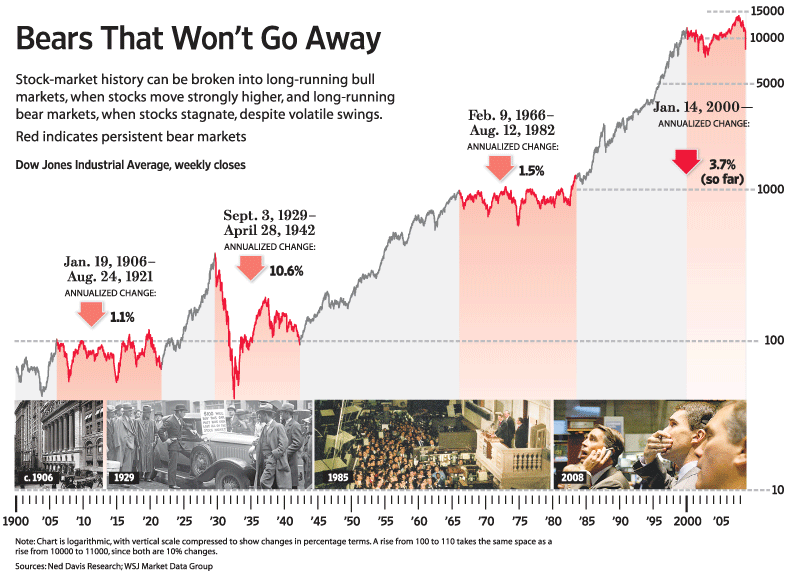
We’ve shown many, many variations of this chart over the years. This one comes from the WSJ:
>
>
Previously:
Market Cycles: 100 Year DJIA (September 09, 2005)
http://bigpicture.typepad.com/comments/2005/09/market_cycles_1.html
100 Year Dow Jones Industrials Chart (December 28, 2005)
http://bigpicture.typepad.com/comments/2005/12/100_year_bull_b.html
Dow Jones Chart (1900-2004)
http://bigpicture.typepad.com/comments/2005/08/dow_jones_chart.html


What's been said:
Discussions found on the web: