Bob Bronson (BRONSON CAPITAL MARKETS RESEARCH) looks at the short term cycles, and concludes the final bottom still isn’t in . . .
~~~
Not only does our work strongly suggest that the Supercycle Bear Stock Market low did not occur at Thursday’s intraday low or Friday’s closing low (March 6th), but in spite of the extremely short term (days) uptrend, the very short term (weeks) trend is not bullish either.
Internal evidence reveals that today sharp gain, which is very typical in a bear market, was largely a unsustainable news-induced short squeeze. So we fully expect downtrend red #5 will continue to make new lows.
Fully half of today’s gains occurred during the first 15 minutes triggered by Bernanke’s statement that the recession will be over by year end if the banks are stabilized. His statement, besides being conditionally obvious, like “you’ll be rich if you start making a lot of money,” was circular and probably purposefully vague. Also, it undoubtedly was delivered to at least partially help encourage buyers of this week’s three separate Treasury auctions for a total of $92 billion of Treasuries…an astronomical $63B of three-year notes, followed the next day by $18B of 10-year Notes, and finally $11B of 30-year bonds. Furthermore, in spite of this huge supply and probable lack of any significant quantitative easing by Fed purchases of Treasurys, such prices are negatively correlated with the stock market during Supercycle Winters – see below — and turned decisively bearish for the stock market starting at least seven days ago forewarned by 90-day T-bills several weeks earlier.
The other half of today’s gains after the first 15 minutes were induced by CitiGroup’s positive earnings report and Barney Frank’s statement about his expectation of a substantial modification of mark to market write downs, and reinstitution of the uptick rule for short sales.
Rather than further dissecting the value of these additional short-squeeze inducing statements, note that today’s trading volume was not even bigger than seven trading days ago when the SPX decisively broke below its Nov 21st 2008 intraday low at 740, which now represents technical resistance. And although today’s advancing volume-to-declining volume ratio was 21:1, the last time this ratio was slightly higher at 23:1, which was last Oct 13th the day after that highly-celebrated bottom at SPX 840, the rally ended during the very next day!
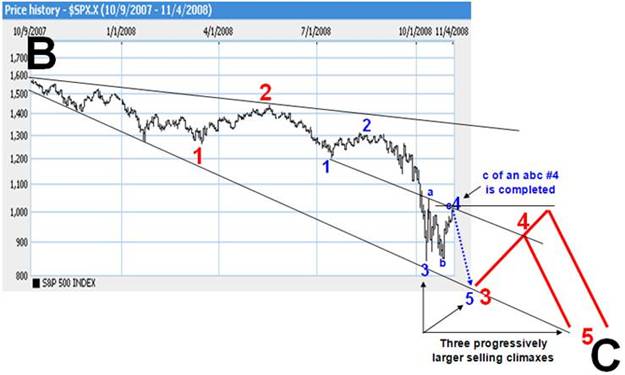
Furthermore, that only one-day rally extension followed a 36:1 downside day, which was similar to the 36:1 one than occurred that same seven trading days ago when the SPX decisively broke below its Nov 21st 2008 intraday low at 740. This parallel is almost eerie since that only three-day rally was the A upleg of the three week up-down-up ABC pattern blue #4 – see chart below – which could be repeated this time as the A upleg of a multiple-week up-down-up ABC pattern subdivision #4 of a five subdivision of red #5 this time.
We’ll make these shorter term subdivision cycle-trend counts more clear during the immediate days ahead, along with S&P’s latest revision to 4Q earnings and their response to Jeremy Siegel’s nonsense criticism thereof.
>
OUR NOV 4 ’08 (blue 4) SELL SIGNAL FOLLOWING OUR MID-MAY (red 2) AND MID-AUGUST (blue 2) SELL SIGNALS
>
EIGHT-WEEK RESULT UP TO OUR JAN 6 ’09 (red 4) SELL SIGNAL
>
The above cycle-trend counts are similar, but importantly different than Elliott Wave Theory both in principle and application – see Exhibit C on page 7 here:
A Forecasting Model That Integrates Multiple Business and Stock-Market Cycles
By Bob Bronson
Bronson Capital Markets Research
Updated January 13, 2008
http://www.financialsense.com/editorials/bronson/model.pdf


What's been said:
Discussions found on the web: