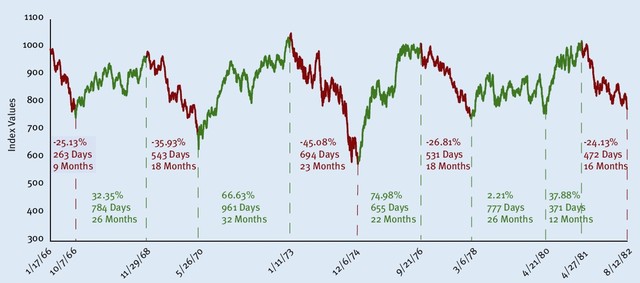
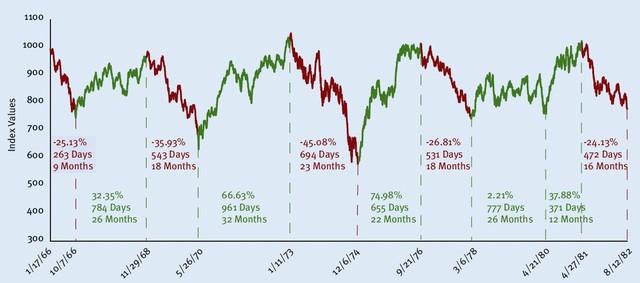
Here’s the 1966-1982 trading range:
>
click for larger chart

chart courtesy of Rydex Funds
>
If we are in fact in a long, post-Bull trading range — see our 100-year Dow chart — than this is year ~5 of what could be a 10-15 year secular Bear market. As the 1966-82 trading range above shows, we may be in for violent moves down and rapid blast offs.
The March to December 2003 cyclical move higher is very consistent with this trading environment.
I am placing us somewhere around late 1972 . . .


Three recessions in that time frame.
We may need to look at the market cap of the DJIA relative to total market cap of publicly traded equities in U.S.
The DJIA may be relatively less than it was historically. Things such as the Nasdaq, and other markets (small and mid-cap) may be relatively more.
There is a very key difference between 1966-1982 and today.
-In January 1973, the DJIA reached a new all-time high (higher than any previous historical level).
-In December 2005, the DJIA is at around 10,800, which is around 8% less than the DJIA all-time high of 11,700 in January 2000.
The average of the 5 declines in your graph of 1966-1982 was a 31% decrease over approx. 500 days.
Given today’s DJIA never recovered as much as it has during historical bear markets, it may be less likely today that the DJIA will drop as much as it did during prior bear markets. Today, the DJIA is still not at all-time highs or near all-time highs.
So, using your graph and unscientific swags, if I did think the DJIA was going to drop in year 2006, i might estimate a 23% drop (31%-8%) on average, with a 37% drop if things get wild (45%-8%).
It would also be necessary to look at interest rates today vs. historical (nominal and real), and dividend yields.
another way to look at this would be the following:
historically, people that invested at all-time market highs sometimes come out okay if they can hold the investment long enough (decades).
given the DJIA is 8% off its high, and that the high occurred more than 5 years ago, a current investment in the DJIA may not be horrible for people with long-term horizons.
however, history does not predict the future. who knows.
“I am placing us somewhere around late 1972”
The DJIA high during Q4 of 1972 was higher than any other previous daily close prior to Q4 of 1972.
This is not true today.
Reasoning by analogy can be dangerous.
Barry,
Thanks for your blog I enjoyed it all year.
Thanks to you I read Bull last week, a great read.
I have been looking at the same chart and have us at the end of ’76 based on the 50 and 7 year biblical cycles .
Time will tell.
Thanks again,
Barry M
I’m drawing several different comparisons:
The first is how markets do after Bullmarkets end, or post crash. Clearly as yesterdays chart shows, what follows is typically a long refractory period.
If you accept that logic, then you may be wondering where we are in that process, almost 6 years after the Bull stalled.
Are we in 1936? Is this analogous to 1973? Over the past century, we have 3 major Bulls and 32 major Bears to compare to. The post 2000 period is # 4.
So there are very fewe analogous periods –none perfect.
I do not buy the end of 1976 comparison. 1976 was 10 years into the bear. The bear market had already reached a false top in the DJIA around 1973.
The DJIA is not 10 years into a bear market, and the DJIA has reached no new false top in the current bear market.
While I do believe in momentum effects and patterns, I also do believe a lot of this is random and independent. Looking for historical patterns to predict the the future is valuable and entertaining, yet not always relevant.
My bogey for the future is international. How much product was sold by DJIA companies to foreign countries on credit? (vs. collecting cash at the time of sale) How long does it take foreign countries to pay DJIA for products? Where is the foreign credit risk concentrated for DJIA countries? (Asia, Europe, Latin America)
Peace
Many available analogies to 1929 top and 2000 top as well. Comparing the NAZ of today to the DJI of 1929 given the nature of the NAZ today is where most dynamic, new economy stocks trade.
The overlays are almost scary in their accuracy TO DATE. Doesn’t mean it will continue. But, as a post bubble equity environment, that is really the only true comparative I see in modern times.
Btw, the overlay shows one heck of an equities run if the chart continues mimick post 1929. Not a new high but a time to be invested………..for what it’s worth.
It may be that this run mimicks post 1929.
Certianly an argument could be made that international money is comming to north america holding down long rates. Maybe good for stocks??
I am looking for economic tipping points ie points at which everyone knew the world of economics had changed. Two of them 50 years apart Oct 29 and Oct 79(Volker shut off money supply)
Two 14 years apart Oct 87 black monday and Sep/Oct 01 (9/11,and Enron etc.)
The charts don’t always show these things but if you where there you know.
Barry M
I sent this to my dad, he liked it but requests a version for those people with Red Green color blindness.
What were India and China up to in 1972?
Can you tell I think it’s significantly in the weeds from normal this time…
Some Last Week of Trading
I find it very interesting that everyone assumed (including yours truly) that in a flat year the last low-volume week of the year will be up. It isn’t. It will cover one more model that I have that was screaming duck since Monday, but after th