Our story so far:
Following the 2,000 Dot Com crash, then Fed Chair Alan Greenspan brought Fed Funds rates down to ultra-low levels. Under 2% for 3 years, and 1% for more than a year.
Rates this low — and for that long — were simply unprecedented. They wreaked havoc with the traditional fixed income market. Bond managers scrambled for yield, and found it in investment grade, triple A rated residential mortgage-backed securities (RMBS). This better interest rate was created by securitizing mortgages with an unhealthy slug of higher yielding, riskier, sub-prime mortgages.
The demand for RMBS paper was nearly insatiable. Wall Street sucked up as much sub-prime paper as could be legitimately, then illegitimately produced. Lend-to-securitize-nonbank mortgage writers responded to the demand by abdicating traditional lending standards. 30 year mortgages were given to people who in no conceivable way could afford them. The hope was a non-default over the warranty period of the mortgage, typically 90 or 180 days.
The Greenspan Fed, in charge of supervising financial lending institutions, looked the other way.
The net result of this was a credit bubble and a housing boom. (A true housing bubble formed only in a handful of places). The credit bubble allowed 10s of millions of Americans to become, albeit temporarily, home owners.
In 1992, some 4 million homes per year were being purchased. A decade later, that number had risen 25% to 5 million. A mere 3 years later, annual sales were 7 million units — a 40% increase. From 2002 to 2007, the abdication of lending standards — who cares about credit scores, incomes, debt load, assets, even job! — created millions of new homeowners. And thanks to the ultra low rates, prices had exploded. The combination of brand new, unsophisticated buyers and rapidly rising prices was a dangerous combination.
Buyers of limited financial means who en masse overpaid for their houses at ultra low rates was a recipe for disaster. The Fed began its cyclical tightening, price appreciation slowed, then reversed. Sales plummeted, and prices fell. Five million of those buyers were foreclosed upon, with another 5 million likely to come.
Which more or less brings you up to date.
~~~
Today, residential real estate confronts numerous headwinds: Credit, once given to anyone who could fog a mirror, is now tight. Hence, demand is far below what it was during the past decade. Home prices are still unwinding from artificially high levels, and remained over-priced. Inventory is elevated. Unemployment remains high. A huge supply of shadow inventory is out there: Speculators and flippers who overpaid but have held onto their properties await modestly higher prices to sell. Bank owned real estate (REOs) continues to increase. We are barely halfway through a decade long foreclosure surge.
This is known, or at least should be by those who have looked at the data. I cannot explain why some economists still have not figured this out.
In my analysis, price stands out as being the prime mover of the next leg down. High unemployment, and a decade of flat wages aren’t helping to create any new housing demand. And the millions in homes they cannot afford will eventually add more pressure to inventory and prices.
But the bottom line is Home prices remain too high: There can be no doubt that home prices have moved way down from the 2005-06 peaks. How did I reach the conclusion that, even after a 33% decrease in prices?
By using traditional metrics. Whether we are looking at US housing stock as a percentage of GDP or Median income vs home prices or even ownership vs renting costs, prices remain elevated. Indeed, we see prices remain above historic mean.
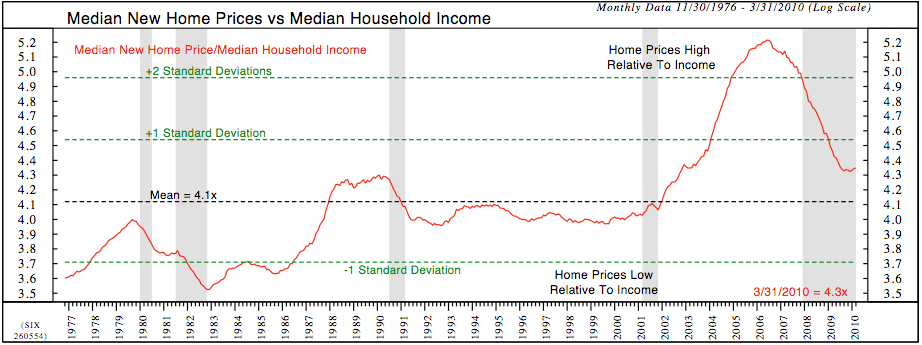
Consider price relative to income. From 1977 to 2010, the median US home price was 4.1 times median household income. But as the chart below shows, Home prices are still above that mean. Oh, and that mean is artificially elevated due to the 2002-07 boom. Same with home prices relative to rentals, or housing value as percentage of GDP.
Further, we should not assume that prices will merely mean revert back to historic levels. In most markets, a near 3 standard deviation price move is resolved not by reverting to the mean, but by by careening far below it.
>
New Home Prices vs Median Income
Home vs Rent

Charts courtesy of Ned Davis Research.
>
We can look at numerous other factors. Employment, inventory, REOs, credit, another wave of foreclosures. etc. But the bottom line remains that prices must revert to a sustainable level, and we simply aren’t there — yet.
Yes, government policies temporarily stopped prices from finding their natural levels. Now that the tax credit has ended, and most mortgage mods are failing, the prior downtrend in price will now resume.
Neither the Bush nor the Obama White House seemed to truly understand this. The assumption has been that if we can modify mortgages or voluntarily refrain from foreclosures, the RRE market will stabilize. Through a combination of mortgage mods and buyers tax credits, the government has managed to — temporarily– create artificial demand and keep more supply off of the markets.
But as we have seen, that fix was at best temporary.
One of the things that Markets are best at is price discovery — the determination of a price for a specific item through basic supply and demand factors. Without the heavy hand of the government intervening, the residential real estate market is about to experience what price discovery is all about . . .


What's been said:
Discussions found on the web: