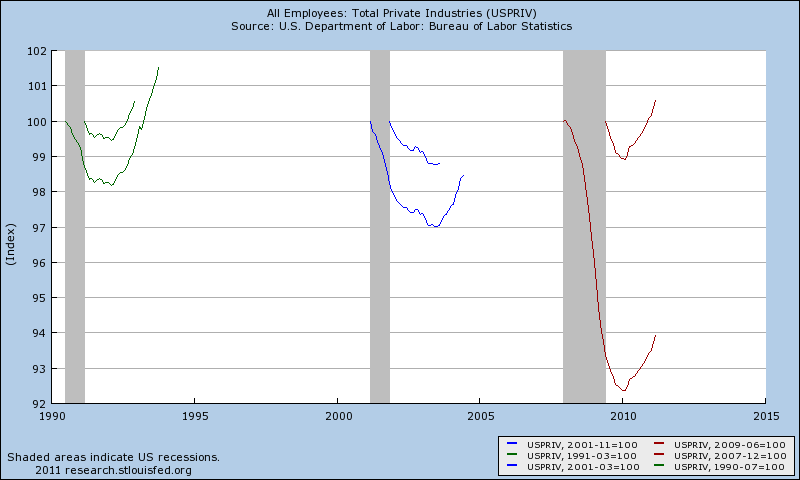
Want a decidedly different way to think about the post recession employment situation? Try indexing the jobs recovery to the beginning and end of Recessions (see chart below).
That relative perspective informs you as to what the last business cycle recession we saw way back in 1990. Whenever economists talk about Post WW2 recession/recoveries, what they mean is “a cycle like 1990.” Note that we haven’t had an ordinary recession/recovery cycle like 1990 in the 21 years since (perhaps this helps to explain why economists as a group have stunk the joint up).
The 2001 contraction was a post-market bubble/crash recession. The booming economy and technological gains drove things for a decade until they went full on bubble. That ultra-low rate driven recovery took 47 months — an unusually long time — for jobs to come back.
The 2007-09 contraction was a credit crisis driven recession. Its depth and breadth make it different than ordinary cyclical recessions. It was caused in part by the Fed action following the 2001 recession.
>
Employment Indexed to Beginning/End of Recession
click for larger graph

Chart courtesy of St. Louis Fed; concept by Invictus
>
I cant wait to see WTF the next recession is going to look like . . .


What's been said:
Discussions found on the web: