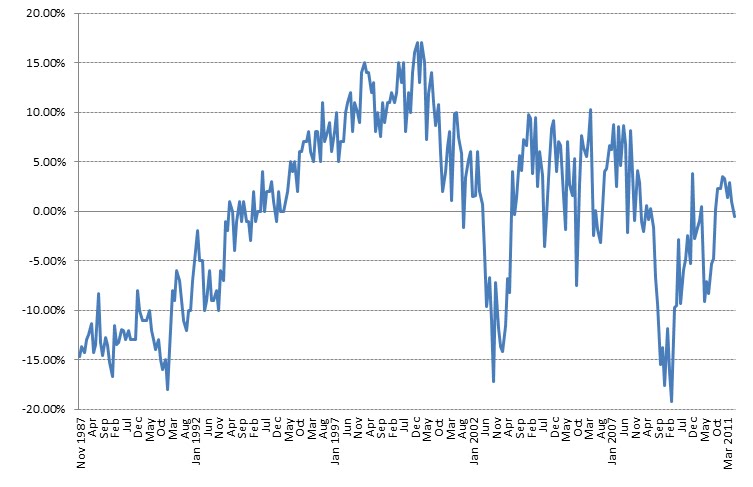
Kevin Lane observes:
“The chart below looks at how far investors have deviated in their equity asset allocations relative to the 25 year mean of a 60.00 % commitment to equities. As seen below current asset allocations to equities are just slightly below the aforementioned mean. Thus investors are not presently over committed to stocks like they were in 2000 when their allocations hit 18.00 % above the mean or 78.00 % commitment to equities. (Note the extreme under commitment to equities in 1987, 1990, 2002 and 2009 … all great buying opportunities.)”
>
Source: Fusion IQ
>
“Typically this indicator is best used at extremes to help gauge sentiment and related available liquidity (or lack thereof) that can come from extreme over commitment (ie. investors all in thus no buying power left to support higher equity prices) or extreme under commitment (ie. investors all out of stocks thus plenty of sideline liquidity to support stocks and a rally). What I think this indicator tells us at present is there is still available investor liquidity available to buy stocks with investors only at their mean commitment to stocks.
Thus any subsequent correction that may develop should be somewhat limited in scale and duration (ie. A modest corrections in the 5% to 12% variety). So while it doesn’t mean we can’t or won’t correct it does suggest that if a correction develops there should be bids below the market given liquidity is somewhat ample.”


What's been said:
Discussions found on the web: