Inlight of this mornings stronger than expected ADP data, I thought it was a good time to see Matt Trivisonno’s Withholding-Tax Collection data from The Daily Jobs Update. Perhaps it that might provide some early insight into Friday’s NFP.
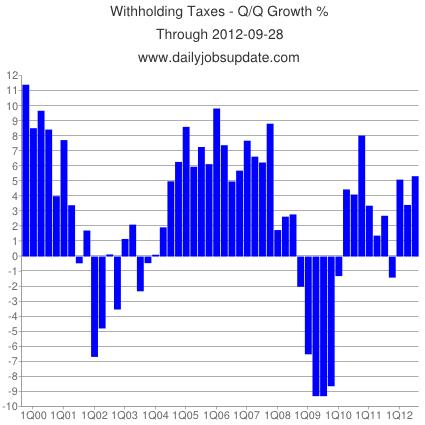
The chart below shows that federal withholding-tax collections were strong in the Q3 – up a healthy 5.34%.
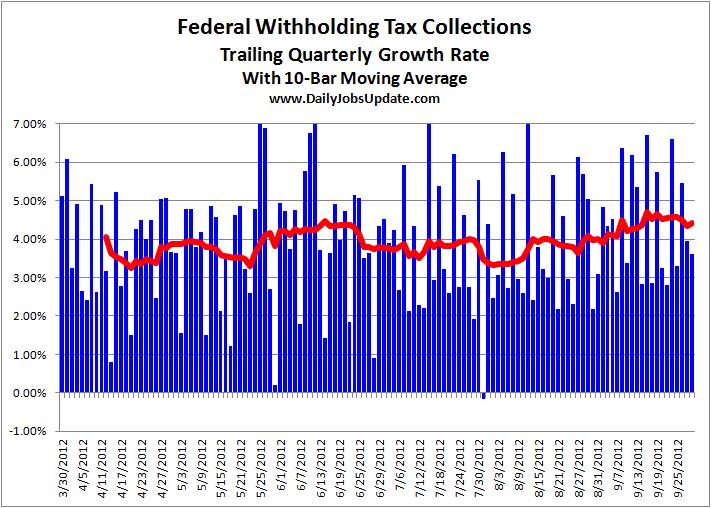
The next chart shows how the growth rate is evolving. In the beginning of Q3 (early July), it was under 4% — however, it moved higher in August and September (note the moving average (red line) rising.
Matt adds:
The quarter came in strong, and finished with good momentum. This data corroborates the recent improvement we’ve seen in unemployment claims, and the upward revisions in the job-creation numbers from the BLS.
We have seen some scary numbers recently, such as the 13.2% drop in August durable-goods orders. So there are two possibilities: The economy went through a “soft patch” that was not severe enough to cause layoffs, and is already bouncing back. Or a contraction is just getting underway and has not yet triggered layoffs.
Time will tell which scenario is correct. In the mean time, Friday’s big non-farm payrolls report shouldn’t contain any nasty surprises, and might even deliver an upside surprise.
Note: the second chart plots the Q/Q growth rate each day, for the quarter ending on that day. Because of the way the calendar works, it swings wildly, hence the moving average to smooth things out. It also uses a fixed number of days instead of calendar periods. And that’s why it stands near 4.5% while the top chart is at 5.3%. The latter calendar-period calculation is the “official” rate, though a more realistic assessment would be closer to 5.0% because the calendar-quarter benefited from some collections bleeding over from August to July.
All charts from dailyjobsupdate.com


What's been said:
Discussions found on the web: