Source: Free Stock Charts
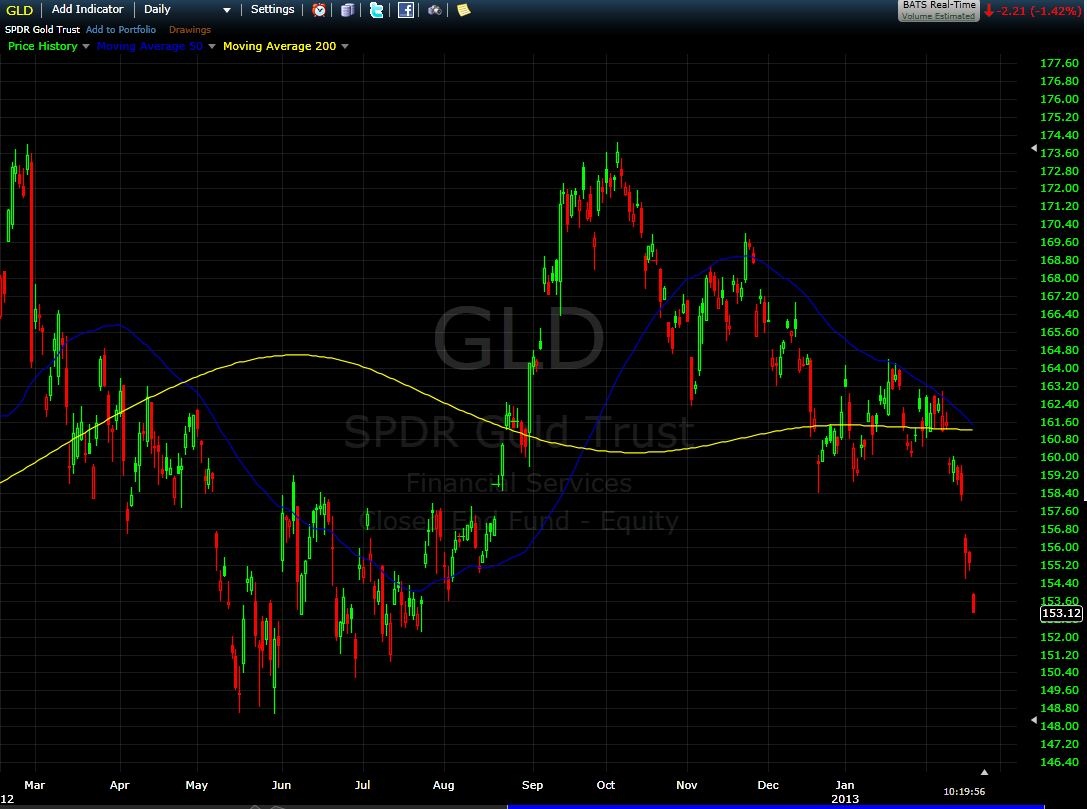
I’ve been seeing some chatter about the Death Cross for Gold.
We’ve addressed the Death Cross previously — its a rather meaningless signal. And the Golden Cross isn’t much better.
What have these crosses told us about Gold? Well, not very much.
Consider: Since April 2012 we have witnessed the 50 day moving average crossing above or below the 200 day moving average on three separate occasions.
1. The Death Cross flashed for GLD on April 26, 2012. Over the prior 50 trading days, GLD had lost ~3.5%. After the cross, it lost another 7.7% over 13 sessions. (Chalk one up for the Death Cross)
2. A Golden Cross for GLD flashed September 20, 2012. Over the prior 50 trading days, GLD had rallied 12%. 29 days after the Golden Cross signal, down 5.3% — 62 days later, it was down 7.6% (Very bad signal for Golden Cross)
3. There will be another Death Cross imminently. GLD prices 50 days ago (12/7/2012), were appreciably higher ($165.16), and is now down 7% from 50 days ago. (Jury is out).
4. It took only 100 days for the Golden Cross to cascade into the Death Cross. This hardly provides much confidence as to the acumen of these signals.
As we have shown previously, death crosses are not all that predictive of much of anything; Golden crosses are not any better. These mostly tell us where we came from, and not where we are going.
Previously:
Worry About Important Things — Not The Death Cross (August 16th, 2011)
How Bullish is the Golden Cross? (January 30th, 2012)


What's been said:
Discussions found on the web: