Scrambling for Returns
John Mauldin
February 19, 2013

In this special edition of Outside the Box, World Money Analyst contributor Ankur Shah digs in his heels to help us all stay uphill from the slow-motion, jumbled landslide of bond yields and equity returns. Putting some solid analysis under our feet, he leads us onward and upward, dodging dislodged corporate-earnings boulders, relaying warnings shouted back by Head Sherpa Bill Gross, guiding us up the narrow but rock-solid ridge of dividend yields – and what’s that we see glimmering up there, through the swirling mists; can it be this mountain really is capped with gold? To the summit, then!
In all seriousness, Ankur gives us a somewhat technical analysis of the potential for future stock-market returns. This makes a great companion piece to the work Ed Easterling and I did a few weeks back on secular bear markets. In short, the data are not consistent with the beginning of a new secular bull market. Returns are likely to be muted over the next few years.
And how long can total corporate profits continue to stay at all-time highs in terms of GDP? That factor has always been mean-reverting. For a secular bull market to begin from here, we would have to see that percentage go yet higher in what is a low-growth world. Stranger things have happened, but do you want to bet against gravity, and without some way (like a new growth engine) to counteract it?
Ankur and the rest of the World Money Analyst team surefootedly tackle the challenges of investing in uncertain times. Their mandate is to deliver the view from the summit, expanding your vision beyond the US to encompass the entire planet. If you like the piece below, I recommend you check out World Money Analyst. Its global perspective will broaden your investing horizons to take in a whole new world of intelligent, risk-sensitive opportunities.
As an aside, Mauldin Economics just recently added World Money Analyst to its quiver of publications. I have read it admiringly for some time, and when the opportunity came to acquire it, I did so without hesitation. I love the truly global view and specific recommendations from a very solid cast of characters. From their far-flung perches, they look on the world differently than most of us. They make me think about a different set of opportunities and remind me that we still live in a world where opportunity waits over every horizon.
Plus, I saw the opportunity to weave in a few of my own contacts who deserve a wider audience: proven talents with great records, some of whose names you know. This is a truly great letter for those looking for global investment recommendations – and at a very reasonable introductory price. You can learn more by clicking here.
And now, let’s think nimbly about the stock markets and future returns.
John Mauldin, Editor
Outside the Box
subscribers@mauldineconomics.com
Scrambling for Returns
By Ankur Shah
Success in investing, as with life, sometimes boils down to timing. When I graduated from college in the late ‘90s, I actually had an offer to join PIMCO, which at the time was a relatively small, fixed-income manager tucked away in Newport Beach, California. I remember visiting their headquarters building, with its sweeping view of the Pacific Ocean. I could only imagine Bill Gross at his desk, gazing at the blue expanse and pondering the fate of interest rates across the developed world.
Despite my reverence for Mr. Gross, I chose a different career path, due to my youthful ignorance. I thought to myself, Why would anyone want to be a fixed-income investor when the “real” money is in equities? As we now know, I inadvertently ended up missing the tail-end of the ongoing bull market in US treasuries and caught the brunt of the secular bear market in equities that began in 2000.
We can see from the chart below that yields on US treasuries are at generational lows. As yield declines, the price of bonds rises. Given the unprecedented level of yields on US treasuries, we are, in my view, close to the end of the secular bull market in government bonds.

As Martin Pring highlighted in his book Investing in the Second Lost Decade:
At the culmination of the 1982-2000 secular bull market in stocks the Fidelity Magellan Fund (a stock fund) was the largest mutual fund in the world. In 2012, the largest mutual fund in the world is the PIMCO Total Return Fund – a bond fund!
It’s no surprise that PIMCO Total Return is the world’s largest fund, given that the secular bull market in government debt began in 1981. The question that remains for investors is, with yields so low for US treasuries, what is the upside in terms of prices, from current levels? After all, interest rates are zero-bound at the end of the day. Even Gross himself recently Tweeted, “Gross: Makin’ money with money gettin’ harder every day. When yields approach zero, all financial assets are squeezed.” If the “Bond King” is having trouble finding a decent return, what can we mere mortals hope to achieve?
If fixed-income can’t provide the inflation-adjusted returns that retirement-bound investors so desperately seek, then equities might be the key. Unfortunately, Gross doesn’t see much hope for equities, either. He recently stirred up a bit of controversy in the normally staid world of asset management with his claim that the “cult of equity” was dying, in his August, 2012 Investment Outlook. I actually agree with his original premise that by the end of the current secular bear market in equities, investors will be completely turned off from equities as an asset class. Investors are in for a rough ride, and will earn far less in the current decade than the historical 6.6% annual real return achieved over the past 100 years.
Gross’s argument had two main pillars:
1. Since 1912, equities have provided a real return of 6.6%, surpassing real GDP growth of 3.5% over the same timeframe. Essentially, he’s arguing that if stocks continue to appreciate at a faster rate than GDP, then stockholders will eventually own a disproportionate share of total wealth. Thus, expected real returns to shareholders can’t outstrip GDP growth indefinitely.
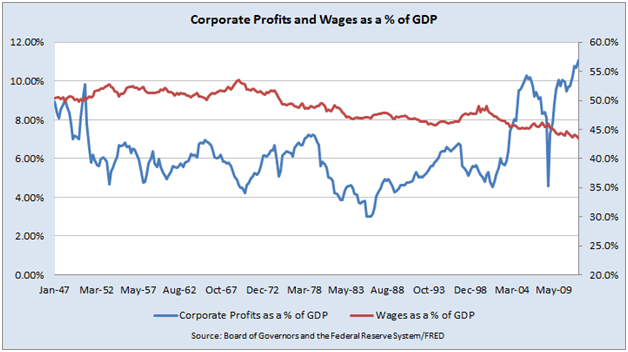
2. As a percentage of GDP, wages are near an all-time low, concurrent with corporate profits near an all-time high. Corporate profit margins will eventually mean revert.
I agree with Gross that equity investors are facing sub-par returns going forward, but I disagree with the first pillar of his argument. To explain my view, let’s start with the basics. Total annual return is calculated as follows:
Total Stock Return = [(P1 – P0) + D] / P0
P0 = Initial price
P1 = Ending price (period 1)
D = Dividends
Essentially, your total return is determined by two components – price appreciation and dividends – in any given year. Using data graciously provided for free and updated on a regular basis by Robert Shiller (http://www.econ.yale.edu/~shiller/data.htm), I calculated that annualized real returns from equities have been 6.27% since 1871 (the earliest data available). Although I use a longer timeframe than Gross, my calculation of real returns is in the same ballpark.
The key point is that over that timeframe dividends have accounted for 70% of the total annualized real return to investors. Price appreciation added the other 30%.
Price appreciation is ultimately driven by a combination of earnings growth and multiple expansion. Gross is correct when he states that earnings growth is constrained by GDP growth. Additionally, we assume that price multiples will mean revert, which has been the case historically.
Dividends, which are typically spent and not perpetually reinvested, are the main reason that equity investors have achieved real returns well above the rate of GDP growth. If investors had reinvested their dividends, we would expect that over time real returns to equity holders would have diminished as an increasing amount of capital chased after limited profit-making opportunities. Thus, there is nothing inherently illogical about real equity returns outstripping real GDP growth, if we take into consideration that dividends are usually spent and not reinvested.
The second point that Gross raises is correct. We can see in the chart below that corporate profits (after tax) as a percentage of GDP have reached an all-time high. Conversely, wages as a percentage of GDP have consistently declined since the 1970s. Gross makes the point that the division of GDP between capital, labor, and government can vary over time and greatly advantage one constituency over another. It’s clear that since the end of the 2008 recession, the corporate sector has been the winner.
However, as fund manager John Hussman has consistently stated, corporate profit margins are mean reverting and current profitability levels are unsustainable. If you agree that margins in the corporate sector have peaked, it’s unlikely that the stock market can sustain rising price multiples.

Analysts who view current valuations as cheap on a forward operating earnings basis are making a huge assumption that current profit margins are sustainable. However, analysts who take a normalized earnings approach to valuation will inevitably come to the opposite conclusion. As Hussman observed in a weekly market comment:
“Profit margins are also highly cyclical over time. The wide margins at present are partly the result of deficit spending amounting to more than 8% of GDP – where government transfer payments are still holding up nearly 20% of total consumer spending, and partly the result of foreign labor outsourcing (directly, and also indirectly through imported intermediate goods) which has held down wage and salary payouts. Indeed, the ratio of corporate profits to GDP is now close to 70% above its long-term norm.”
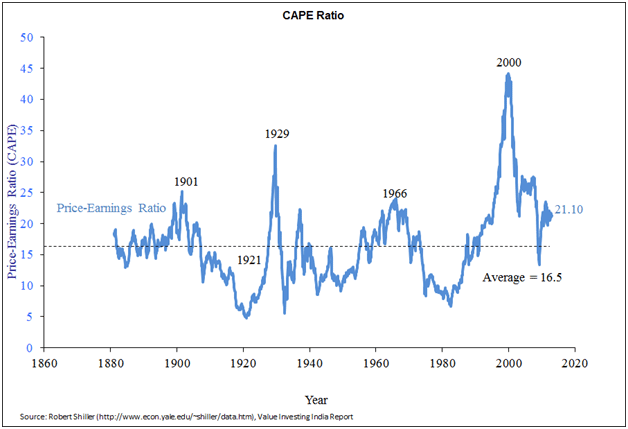
In addition to the potential for declining margins, valuations as measured by the cyclically adjusted P/E ratio (CAPE) are still stretched. Earnings – the denominator in the CAPE ratio – are calculated by taking an average of the past 10 years. By using an average, we normalize for changes in profitability that occur due to the business cycle. Unfortunately, the CAPE ratio doesn’t tell you where the market will head in the next quarter or year, but is an exceptionally useful tool when calculating prospective returns over a long timeframe, such as a decade.
We’re nowhere near the peak levels achieved during the technology boom, but current levels still exceed the historical average of 16.5x, shown in the next chart.

The chart also shows that the market was briefly cheap on a normalized basis in March 2009. Despite the protestations of some analysts, we are not in a new secular bull market for equities. Secular bull markets begin when the CAPE ratio is in the single digits.
What type of return from US equities can we expect going forward, given the current CAPE reading of 21.1x? We can calculate prospective long-term annual total return on the S&P 500 by utilizing the following formula derived by John Hussman:
Long Term Total Return = (1 + g)(Future PE / Current PE)^(1/T) – 1 + dividend yield (Current PE/Future PE + 1) / 2
g = Prospective growth rate of earnings
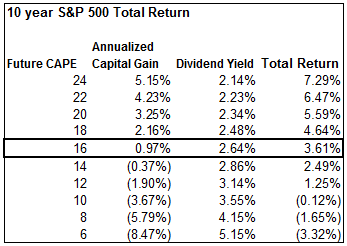
The equation simply forecasts the two components of total return that, as I noted earlier, are price appreciation and dividend yield. Using the data provided by Shiller, I calculated a long-term historical nominal earnings growth rate of 3.8%. Then, using the current 2.8% S&P dividend yield, I calculated prospective nominal returns for various future CAPE ratios, shown in the next table.

We can see from the table that if the CAPE ratio reverted to slightly below its historical mean of 16.5x, it would result in an annualized prospective return on the S&P 500 of 3.61% over the next ten years. And if the market were to de-rate down to a single-digit CAPE ratio, investors could expect negative returns, based on current valuation levels.
Keep in mind that total return is calculated in nominal terms. So, depending on your inflation expectations, real returns over the next 10 years will be nowhere near historical levels unless earnings can grow well above historical averages or investors are willing to re-rate the market from already-lofty valuations. I have no doubt that prospective returns will eventually improve. Unfortunately, that will entail a significantly lower level on the S&P 500.
Even Bill Gross himself warned about the current valuation levels of stocks and bonds when he tweeted the following back in October: “Gross: Stock and bond managers today must be alchemists: turn lead into gold. NOT likely. Too much lead (bubbled assets).”
With both US treasuries and equities offering poor future returns, where can an investor find adequate inflation-adjusted returns?
With the announcement of QE4, the likelihood of significant inflation surfacing in the back-half of the decade has definitely increased. The best options for investors, in my view, are quality domestic and international equities with decent dividend yields, and precious metals. I may have missed the equity bubble of the late ‘90s and the current bond bubble, but the precious metals bubble is just getting started. I don’t plan on missing this one.
 Ankur Shah is the founder of the Value Investing India Report, a leading independent, value-oriented journal of the Indian financial markets. Ankur has more than eight years of equity research experience covering emerging markets, with a focus on Southeast Asia. He has worked as both a buy-side investment analyst for a global long/short equity hedge fund and as a sell-side analyst for an emerging-markets investment bank. Ankur is a graduate of Harvard Business School. You can learn more about his latest views on global markets at Value Investing India Report, or follow him on Twitter.


What's been said:
Discussions found on the web: