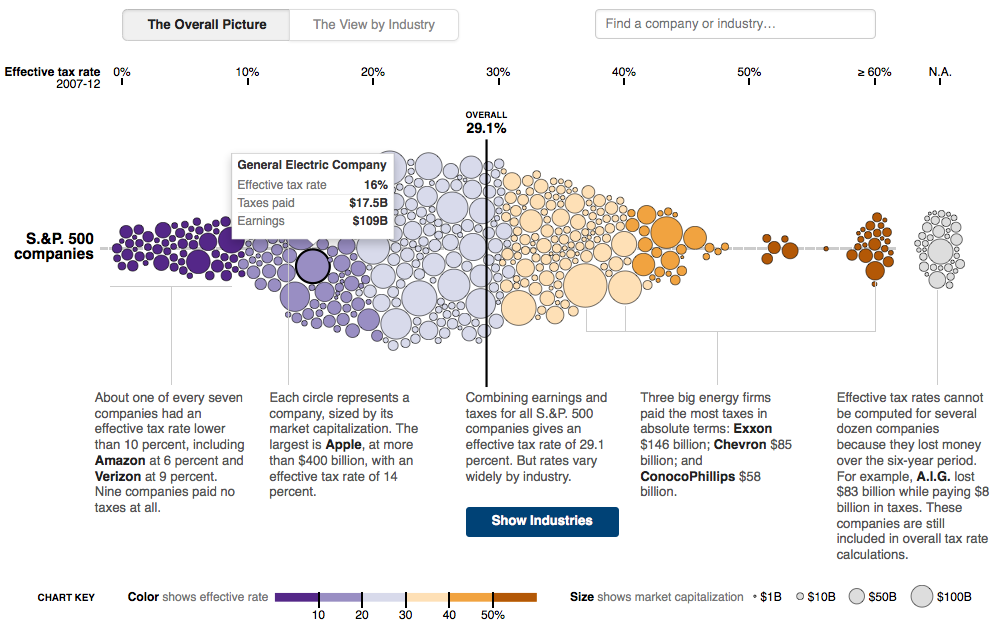
Cool interactive visualization that allows you to see how much various companies are paying in corporate taxes. You can hover over a circle to see what: each firm pays in taxes versus their total revenue & profits, plus the tax rate.
Or, break it down by industry, with a very cool animation showing the sector breakdown. Nice search function, too
Very neat.
Look at these firms also:
Carnival 1%
Ford 3%
Pepco: 3%
Amazon 6%
Boeing 7%
Valero 8%
Verizon 9%
Apple 14%
IBM 15%
Google 17%
Apple at 14% almost looks reasonable!
Source:
Who Will Crack the Code?
DAVID LEONHARDT
NYT, May 25, 2013
http://www.nytimes.com/2013/05/26/opinion/sunday/who-will-crack-the-code.html


What's been said:
Discussions found on the web: