click for ginormous table

Source: Yardeni Research, Inc.
In this morning’s discussion about defining bubbles, a reader made an interesting a posteriori statement: You can tell a bubble after a market has “dived much lower.”
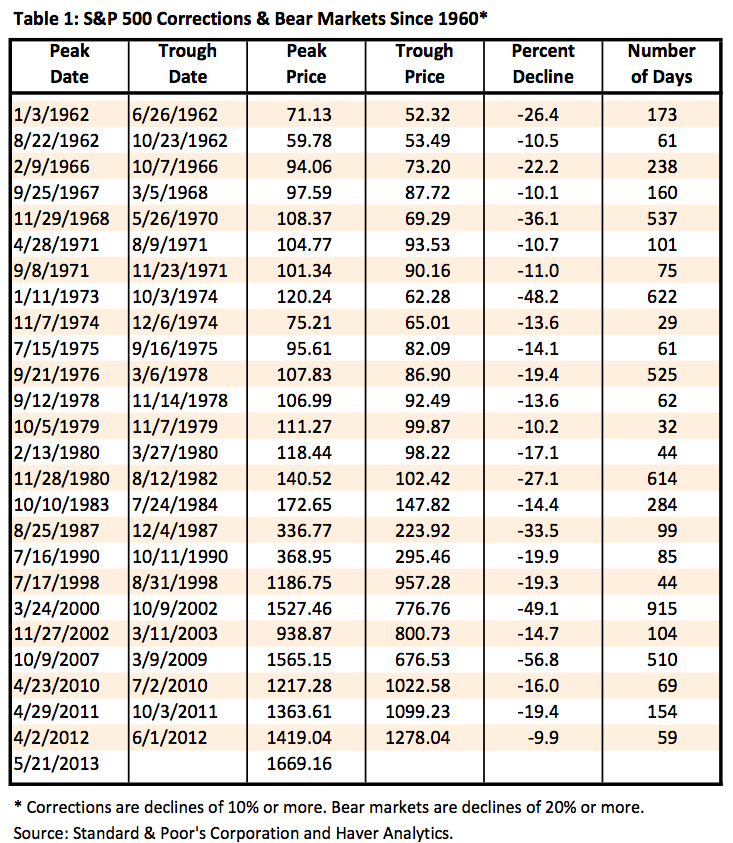
That sent me hunting for some data as to how often markets actually dive. This table is the result of that quick hunt: Dr. Ed Yardeni’s discussion of “S&P 500 Bear Markets & Corrections.” It turns out that these sorts of events are more common than one might have imagined. Defining a correction as a 10 percent or greater drop and a bear market as a 20 percent or worse fall, Yardeni identified 25 such “dives” since 1960. It is interesting to note that we seem to average one of these events (correction or bear market) about every two years.
As to dives — if we make the cut off 30 percent or worse, then we get five examples since 1960: the end of the post-World War II secular bull market in 1968 (36 percent); the 1973 oil-crisis-induced recession and crash (48 percent); the 1987 crash (33 percent); the 2000 dot-com crash (49 percent); and the financial crisis of 2007 (57 percent). Only the last two appear to be bubbles in tech and credit.
I am not sure exactly what to make of these, other than to say that diving markets in and of themselves are not necessarily evidence of a prior bubble.
~~~
Originally published at Bloomberg View


What's been said:
Discussions found on the web: