
Einhorn’s Premature Bubble Call
Are we witnessing another tech bubble?
Bloomberg, April 24, 2014
Earlier this week, Greenlight Capital hedge fund manager David Einhorn reignited the bubble debate that we have spilled so many pixels dissecting. The shorter of Lehman Brothers and the New York Mets fan said in a quarterly letter to clients “we are witnessing our second tech bubble in 15 years.”
The Bubble Chatter is nothing new. Regular readers will recall this has been a n issue I enjoy exploring. Indeed, it has been accompanying the current bull market since it lifted off its lows. Back in 2011, I even created a checklist of “How to Spot a Bubble in Real Time.” And more recently, in November of last year, I noted we seemingly have a “Bubble in Bubbles.”
There certainly are many anecdotal indications of froth. Secondary issues have increased. Mark Zuckerberg has made some questionable acquisitions at what looks like absurd valuations (but last I checked, Zuck is not the determiner of bubbles). We see that Mom and Pop are slowly coming back into the market. Both TD Ameritrade and E*Trade Report saw a 30% jump in activity in the first quarter; Schwab, which tends to me bore investor than trader focused, saw volume rise 13%.
However, as the Wall Street Journal noted, “While market volume tends to rise over time, it was down 35% in 2013 from a peak of 1.947 trillion shares reached in 2009.”
Let’s look at Einhorn’s bubble indicators to see if things have gotten out of hand. The three indicators he listed are:
• The rejection of conventional valuation methods.
• Short-sellers forced to cover due to intolerable losses.
• Huge first-day pops for initial public offerings by companies that have done little more than use the right buzzwords and attract the right venture capital.
Is this an “echo” as Einhorn described it of our previous bubble? Do valuation methods, short covering and IPO pops confirm a bubble?
The answer is, no.
Let’s use Einhorn’s own metrics to see if there is truly a tech bubble rumbling through the Nasdaq these days.
Earlier this month in “Do You See a Bubble?,” we looked at IPO volume and first-day gains as potential signs of a tech bubble. The takeaway was that the first quarter of this year was nothing like the bad old days of late 1999 or early 2000. Have a look at the metrics we listed, and it’s hard to conclude that IPOs today are in bubble territory. The numbers simply are not there.
Next, let’s consider the issue of short selling stocks, a strategy from which Einhorn has profited in the past. If you are looking for some short bashing, you’ve come to the wrong place. I have long argued that shorts are the traders who keep the market honest, root out fraud and corruption, and generally help maintain a reality check when things get goofy.
However, that doesn’t mean they are infallible. Just because short-sellers are forced to cover with big losses doesn’t automatically mean it is a bubble. Any kind of bull market will do the same thing. Keep in mind the current rally followed an immense plunge during the financial crisis. As of mid-2013, more than four years later, markets only recovered to pre-crash highs. That sort of reversion to the mean wreaks havoc on a short seller’s profit and loss.
IPOs and short losses are not indicative of a bubble. But what about the granddaddy of bubble indicators: Valuation?
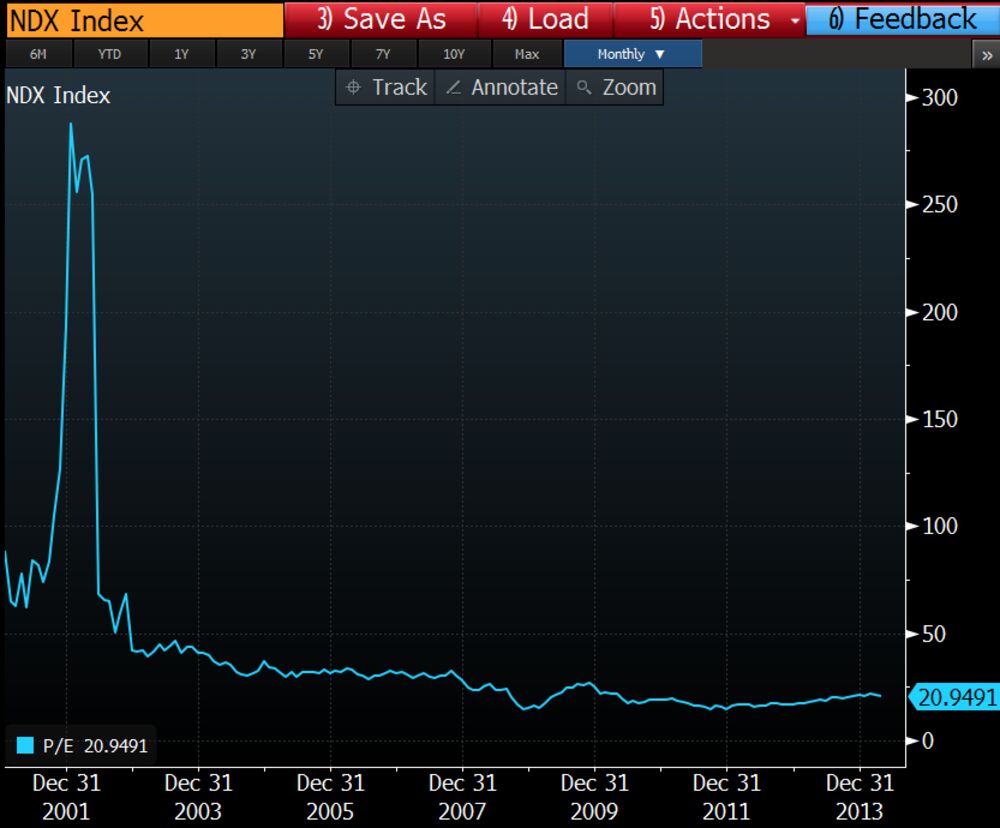
Here is a chart of trailing four-quarter price-earnings rations of the companies in the Nasdaq 100 Stock Index. It speaks for itself:
Now let’s look at the more speculative Dow Jones Internet Composite Index.
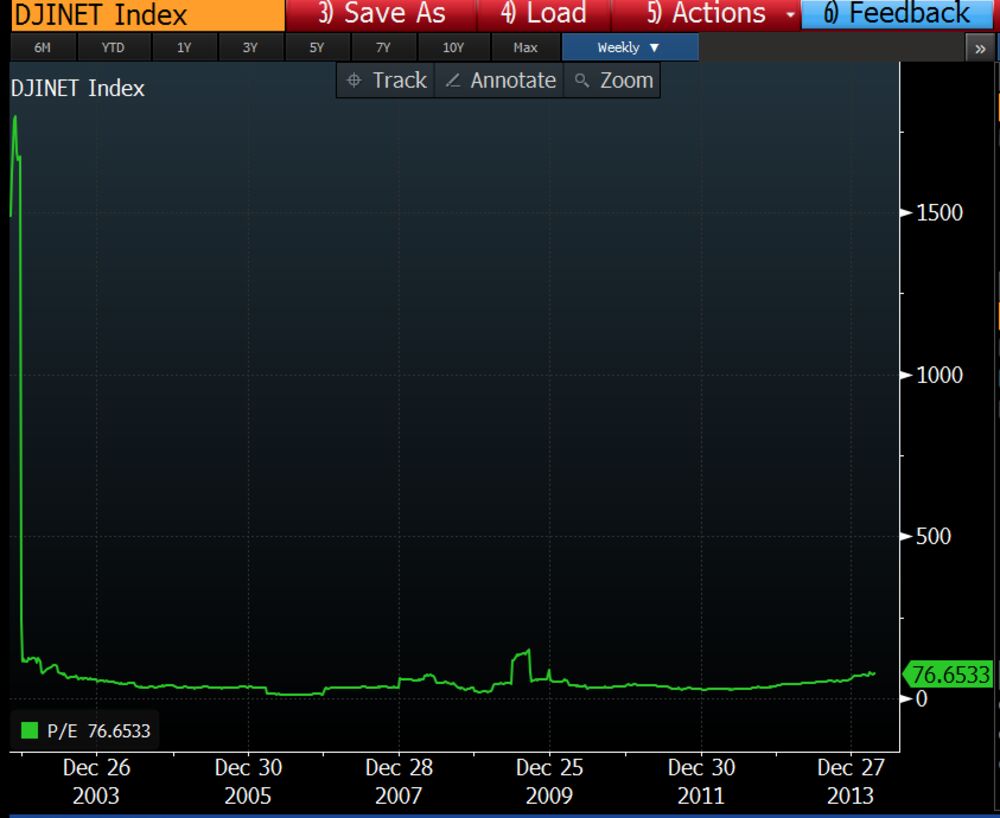
Yes, a P/E of 76 sounds high, but it’s about what it has been for the past decade. And it is nowhere near the insanity of the P/E of almost 2,000 in late 1999.
David Einhorn is a very astute trader and an insightful fund manager. He is a smart guy, and I only rarely find myself in disagreement with him. But when it comes to the declaration of an echo tech bubble, I am on the other side of the argument.
Previously:
Bull or Bubble?: http://www.bloombergview.com/articles/2013-12-05/bull-or-bubble-ritholtz-chart-
The Stages of Bubble Mania: http://www.bloombergview.com/articles/2014-03-18/the-stages-of-bubble-mania-ritholtz-chart
Tech Stocks in Retreat: http://www.bloombergview.com/articles/2014-04-07/tech-stocks-in-retreat
~~~

What's been said:
Discussions found on the web: