Compared with 2007, the U.S. labor market now has about 2.5 million more people working part-time and about 2.2 million fewer people working full-time. In this sense, U.S. businesses are more reliant on part-time workers now than in the past.
But that doesn’t necessarily imply we are moving toward a permanently higher share of the workforce engaged in part-time employment. As our colleague Julie Hotchkiss pointed out, almost all jobs created on net from 2010 to 2014 have been full-time. As a result, from 2009 to 2014, the part-time share of employment has declined from 21 percent to 19 percent and is about halfway back to its prerecession level.
But the decline in part-time utilization is not uniform across industries and occupations. In particular, the decline is much slower for occupations that tend to have an above-average share of people working part-time. This portion of the workforce includes general-service jobs such as food preparation, office and administrative support, janitorial services, personal care services, and sales.
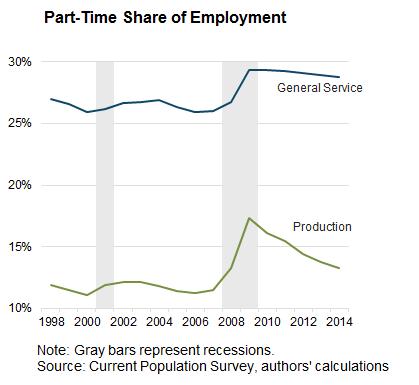
The following chart compares the share of part-time employment for these general-service occupations with the share for production-type occupations (such as machine operators, fabricators, construction workers, and truck drivers).
The above chart suggests that if you talk to retailers or restaurateurs, they will say that they always relied pretty heavily on part-time workers. Their utilization increased during the recession, and it really hasn’t changed much since then. But manufacturers or construction firms are more likely to say that part-time work is not that common, and although they did increase their utilization of part-time workers during the recession by quite a lot, things have been gradually returning to normal.
Why is the part-time share of employment declining more slowly in general-service occupations? The economy has been generating full-time general-service jobs at a much slower pace than in the past. Of the approximately 7.6 million full-time jobs created between 2010 and 2014, only about 17 percent have been in general-service occupations, versus about 32 percent of the 7.8 million full-time jobs created between 2003 and 2007. At the current rate of full-time job creation in general-service occupations, it would take more than 10 years for the part-time share of employment in general-service occupations to return to its prerecession average.
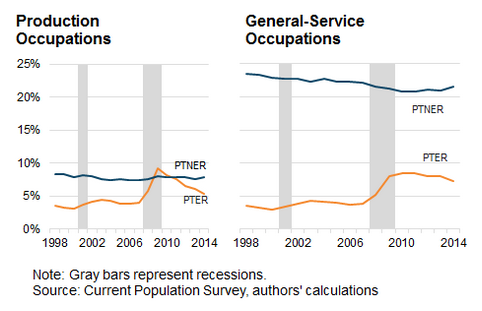
From the workers’ perspective, a relevant question is whether these part-time utilization rates are desirable. Some people work part-time and do not currently want or are not available for full-time work (so-called part-time for noneconomic reasons, PTNER). Others are available and want full-time work but are working part-time because of slack business conditions or the unavailability of full-time jobs (so-called part-time for economic reasons, PTER). The following chart shows the share of employment in the general-service and production occupation groupings that is PTER and PTNER.
The chart indicates that most of the movement in the part-time share of employment is coming from people who want full-time work. In both cases, the share of involuntary part-time employment rose during the recession, but for general-service occupations it has been more persistent than for production jobs.
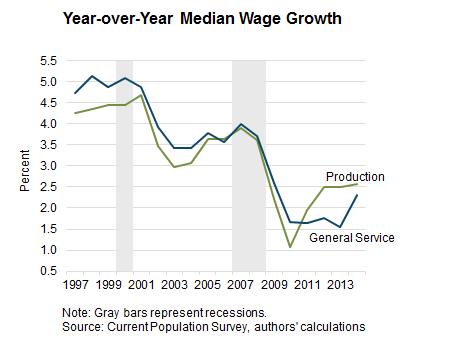
Why has the demand for full-time workers in general-service occupations been more subdued than for other jobs? As the following chart shows, wage growth for these occupations has been quite weak in the past few years, suggesting that employers have not been experiencing much tightness in the supply of workers to fill vacancies for these occupations. Presumably, then, the firms generally find it acceptable to have a greater share of part-time workers than in the past.
The overall share of the workforce employed in part-time jobs is declining and is likely to continue to decline. But the decline is not uniform across industries and occupations. Working part-time has become much more likely in general-service occupations than in the past—and a greater share of those workers are not happy about it.
Source: Federal Reserve Bank of Atlanta


I think that may be the longest article written on the topic without any mention of the passage of the Affordable Care Act in March 2010 and the effect it had in sustaining elevated levels of part time employment, the effects of which would be concentrated in general service employment. Given how the law is structured, those effects also show up in the weekly hours worked data.
then how do you explain it prior top that being passed? notice that full time workers were 7.8 back before it passed, and now are 7.6, if it were that, then it seems to only have sat most reduced by 200k jobs. course lets admit that we never really recovered from that hickup in 2001
The attached below from a post on the Big Picture.
Fig 1 in the second part of the post on page 2 is telling in terms of distribution of jobs and if I read the graph correctly shows a jump in the number of part time jobs over the last 5 years or so to the detriment of full time work.
http://ritholtz.com/2015/02/changes-in-us-household-labor-force-participation-by-household-income/
As the automation/robotics share of worldwide jobs continues to advance, I would expect to see more and more jobs go part-time before human workers are completely eliminated and replaced by automation/robots..