
Futures: New Layout at Bloomberg
June 3, 2015 6:30am by Barry Ritholtz

This content, which contains security-related opinions and/or information, is provided for informational purposes only and should not be relied upon in any manner as professional advice, or an endorsement of any practices, products or services. There can be no guarantees or assurances that the views expressed here will be applicable for any particular facts or circumstances, and should not be relied upon in any manner. You should consult your own advisers as to legal, business, tax, and other related matters concerning any investment. The commentary in this “post” (including any related blog, podcasts, videos, and social media) reflects the personal opinions, viewpoints, and analyses of the Ritholtz Wealth Management employees providing such comments, and should not be regarded the views of Ritholtz Wealth Management LLC. or its respective affiliates or as a description of advisory services provided by Ritholtz Wealth Management or performance returns of any Ritholtz Wealth Management Investments client. References to any securities or digital assets, or performance data, are for illustrative purposes only and do not constitute an investment recommendation or offer to provide investment advisory services. Charts and graphs provided within are for informational purposes solely and should not be relied upon when making any investment decision. Past performance is not indicative of future results. The content speaks only as of the date indicated. Any projections, estimates, forecasts, targets, prospects, and/or opinions expressed in these materials are subject to change without notice and may differ or be contrary to opinions expressed by others. The Compound Media, Inc., an affiliate of Ritholtz Wealth Management, receives payment from various entities for advertisements in affiliated podcasts, blogs and emails. Inclusion of such advertisements does not constitute or imply endorsement, sponsorship or recommendation thereof, or any affiliation therewith, by the Content Creator or by Ritholtz Wealth Management or any of its employees. Investments in securities involve the risk of loss. For additional advertisement disclaimers see here: https://www.ritholtzwealth.com/advertising-disclaimers Please see disclosures here: https://ritholtzwealth.com/blog-disclosures/
What's been said:
Discussions found on the web:Posted Under
Previous Post
How Much Do Oil Prices Affect Inflation?Next Post
10 Wednesday AM Reads
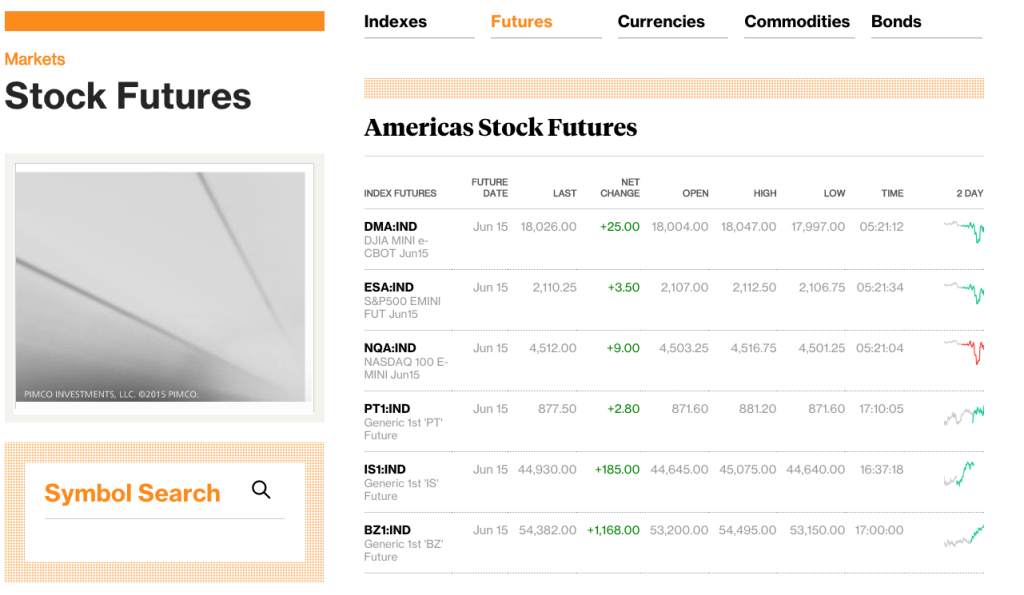
The interface is so clean that no one will have a clue that PT1 means Canada, IS1 means Mexico, and BZ1 means Brazil. (And I’m not letting on how I decoded this closely-held secret.)
Nice thumbnail charts, though … whatever they are!
Well….
http://www.bloomberg.com/markets/rates-bonds/government-bonds/us
The second “Last” column has the market yield. So it needs a little work.
Of course Republicans believe that unless the software works Immediately it’s destined to fail like Obamacare (Which is why the squawking heads spewing GOP nonsense are to be ignored.)
The missing component in the Bloomberg table is what the fair value is. For example S&P futures are down `1 point but that’s from the futures level which is ~two points higher than fair value.
U.S. Stock Futures as shown on CNN Money:
S&P -1.50 / -0.07%
Level 2,114.50
Fair Value 2,112.45
Difference 2.05