@TBPInvictus
Moe and Larry on Seattle’s minimum wage are now joined by Curly, a fellow by the name of Mike Patton, whose recent screed on the topic can be found here.
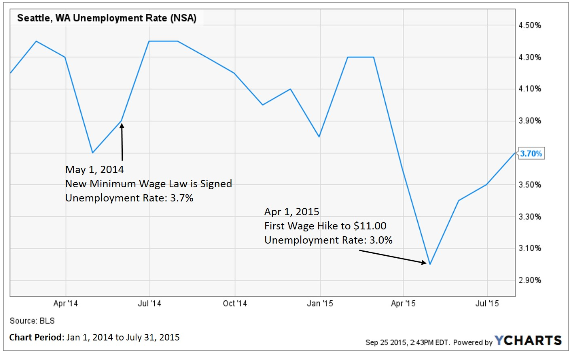
To demonstrate the deliterious effects of Seattle’s new law, Patton provides us the following chart:
(Let’s disregard the fact that what Patton cites as 3.7% is actually 3.9% (May 2014). We’ll let that slide as an honest error.)
Writes Patton:
The following graph [Ed note: Now above] contains Seattle’s unemployment rate from January 1, 2014 to July 31, 2015. I have marked two important dates and included the unemployment rate at those times. When the law was signed, May 1, 2014, Seattle’s unemployment rate was 3.70%. When the first wage hike occurred, April 1, 2015, unemployment was 3.0%. Since then, unemployment has risen steadily while the national average has trended lower.
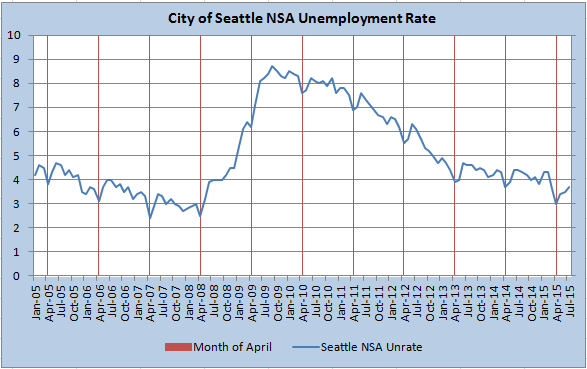
The “NSA” in the chart title indicates that the data are not seasonally adjusted. This matters when analyzing data, and we’ll get to that shortly. For now, though, let’s pull back the lens a bit and see what the Seattle unemployment rate (not seasaonally adjusted) looks like over a longer timeframe than that which Patton provided:
(Source: BLS.gov)
For Mr. Patton’s benefit: The reddish vertical lines correspond to the month of April. You know April – it’s the month during which the unemployment rate troughs in Seattle each and every year (as you can clearly see above). In other words, aside from analyzing a ridiculously short timeframe, seasonality tells us that Seattle’s unemployment rate troughs every April. Like clockwork. As if it were, what’s the word, seasonal. That’s what seasonality is all about – recurring patterns or trends, picked up in data, that can be subsequently adjusted.
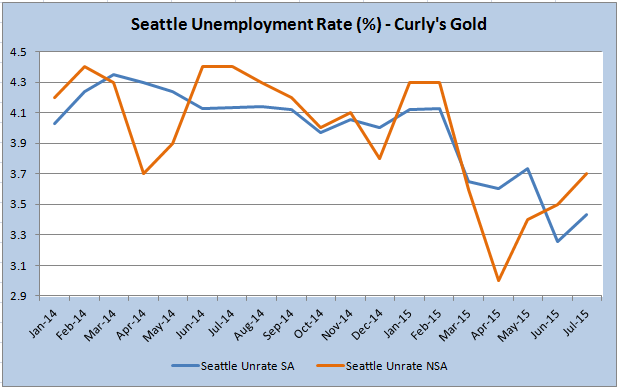
Below is Mr. Patton’s NSA data – in Curly’s Gold – along with the same data seasonally adjusted (in blue). Although the timeframe is still absurdly short to make any meaningful inferences, we can see that the most recent SA unemployment rate, at 3.43%, is still lower than March’s 3.65% or April’s 3.60%. It is, of course, higher than June’s 3.26% but, seriously, how low can we reasonably expect it to go?
(Source: BLS.gov, Seasonal Adjustment by Census Bureau’s X-13ARIMA-SEATS Seasonal Adjustment Program)
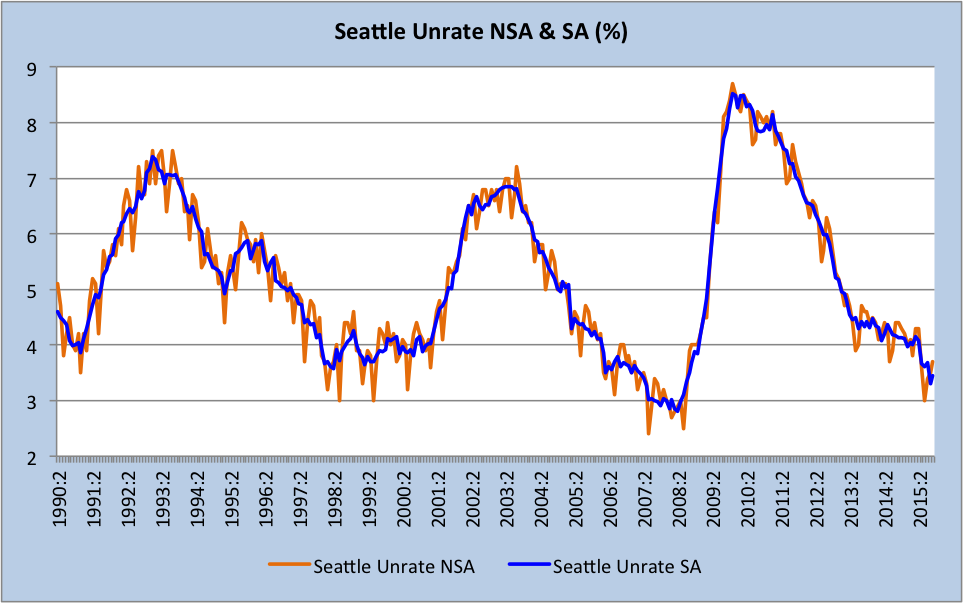
Finally, here’s a longer-term look at the data (from Feb 1990 on) – the jagged sawtooth pattern of the NSA data smoothed out by the seasonal adjustment software. The seasonal annual troughs are clearly visible:
(Source: BLS.gov, Seasonal Adjustment by Census Bureau’s X-13ARIMA-SEATS Seasonal Adjustment Program)
If you can look at the chart above and a) Tell me that you can divine a problem developing with the Seattle unemployment rate and b) Ascribe the root cause of said problem to the April minimum wage hike, well, congratulations, you’re a remarkably astute observer of economics and, apparently, some sort of chart whisperer.
Bottom line: The labor market in Seattle appears fairly tight, with the unemployment rate generally lower than we’ve seen there in almost a decade, since before the Great Recession. That simply cannot last forever. When and why it eventually rises is an open question. One thing, however, is for certain: I’ve yet to see any compelling evidence from the Three Stooges that the city’s new minimum wage is adversely impacting its economy.


What's been said:
Discussions found on the web: