
Source: JPM Quarterly Chart Book
Each quarter, I eagerly look forward to the arrival of JPMorgan’s interactive Guide to the Markets — 70-plus pages of charting pleasure. It’s packed with sexy graphics, loads of data and slick stock, bond, commodity and economic charts.
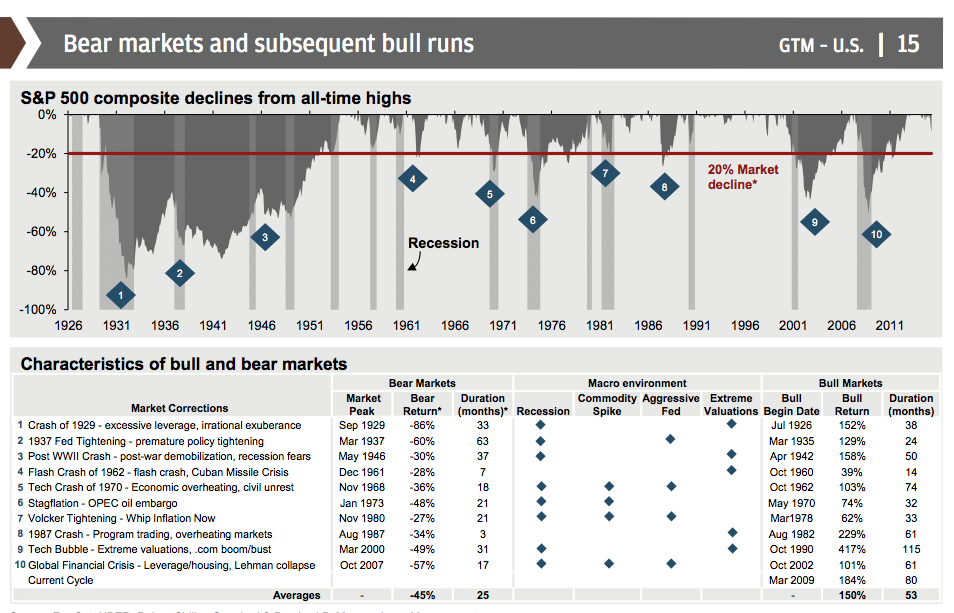
One of my favorites chart is below. It shows the total declines in the Standard & Poor’s 500 Index from highs, as well as the ranking and duration of each bear market. The table offers four possible causes for each episode: recession, commodity spike, tightening by the Federal Reserve and extreme valuations. The table also shows the start date of the subsequent bull market, with its returns (excluding dividends) and duration.
Continues here: Some Bear-Market Insight in One Chart

Great graphic!
Now, can you help me stop my lizard brain from thinking “If I could time this, I’d be rich!” Stupid brain…
A few quick thoughts:
1. The recent market downturn: all things considered, especially if the bottom is in, not so bad.
2. Only 3 recessions since the double-dip that ended c. 1982: the business cycle ain’t what it used to be. People today live in far different times than the earlier post-war period, which was vastly different (and better) than the century that preceded it.
3. The last two bears (and recessions) came from bursting bubbles. No real sign of a bubble in the U.S. The bubble that was the Chinese market burst pretty quickly a few months ago, but that’s hardly likely to have the same impact on the U.S. as the dot-com and housing bubbles going pfft.
4. None of the four causes of declines seems relevant right now. The unanswered question is, How do we grow from here? (I’m not sure if the answer to that is ever clear during dips, but we know from history that growth happens.)
… somehow, the beating Mr Market has delivered since early June does not seem harsh enough to be considered a “bear market” … hell, I’m not even down 30% from my peak, and usually bear markets don’t quit until I have been squeezed hard enuff to make me sell at the bottom … perhaps we are witnessing a “bear market lite”, mitigated by the low-interest rate environment that has made it possible for traders to continue to hold significant amounts of margin debt, and not be pushed to cave in the floor at the bottom with their forced selling … or maybe we’re only in the 4th inning …