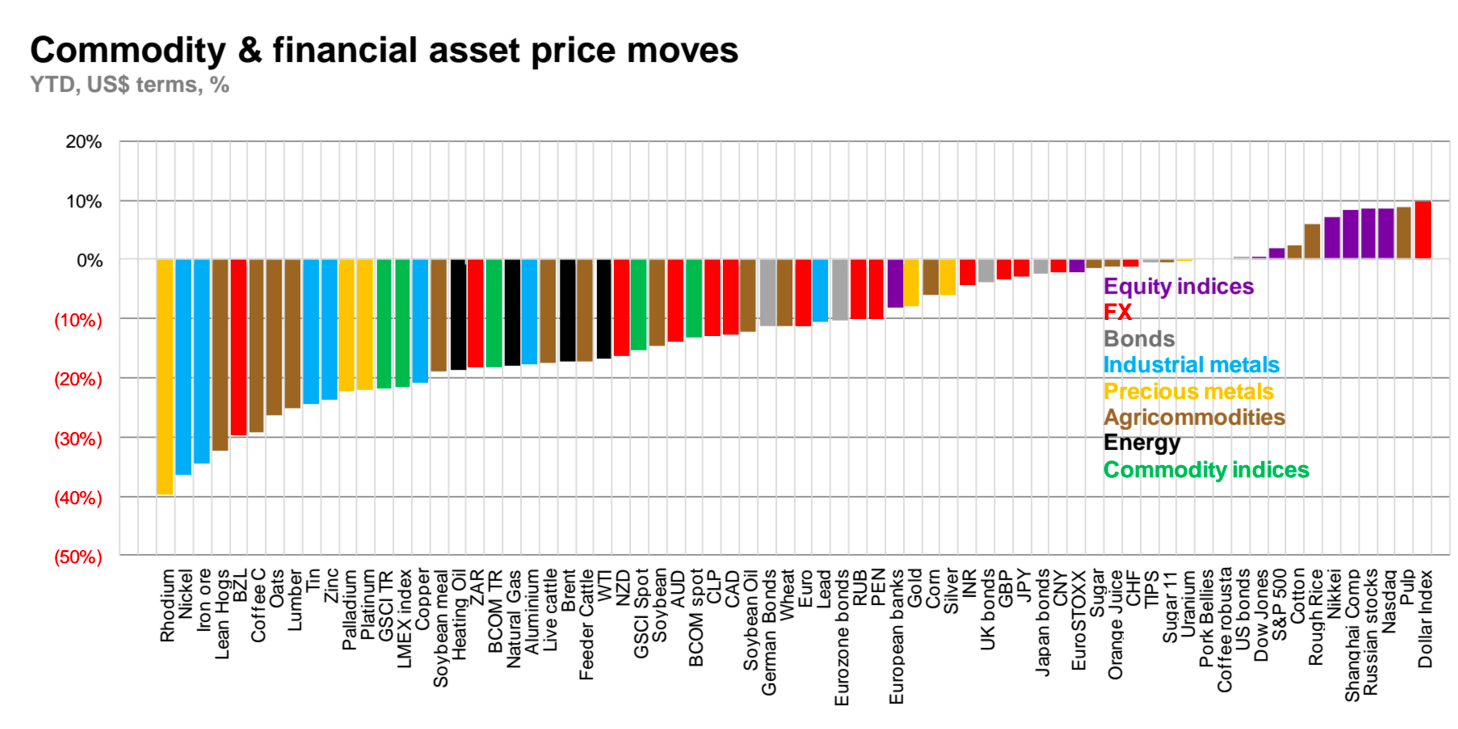
Source: Visual Capitalist
Collapse of Commodities in One Simple Chart
November 20, 2015 12:00pm by Barry Ritholtz
This content, which contains security-related opinions and/or information, is provided for informational purposes only and should not be relied upon in any manner as professional advice, or an endorsement of any practices, products or services. There can be no guarantees or assurances that the views expressed here will be applicable for any particular facts or circumstances, and should not be relied upon in any manner. You should consult your own advisers as to legal, business, tax, and other related matters concerning any investment. The commentary in this “post” (including any related blog, podcasts, videos, and social media) reflects the personal opinions, viewpoints, and analyses of the Ritholtz Wealth Management employees providing such comments, and should not be regarded the views of Ritholtz Wealth Management LLC. or its respective affiliates or as a description of advisory services provided by Ritholtz Wealth Management or performance returns of any Ritholtz Wealth Management Investments client. References to any securities or digital assets, or performance data, are for illustrative purposes only and do not constitute an investment recommendation or offer to provide investment advisory services. Charts and graphs provided within are for informational purposes solely and should not be relied upon when making any investment decision. Past performance is not indicative of future results. The content speaks only as of the date indicated. Any projections, estimates, forecasts, targets, prospects, and/or opinions expressed in these materials are subject to change without notice and may differ or be contrary to opinions expressed by others. The Compound Media, Inc., an affiliate of Ritholtz Wealth Management, receives payment from various entities for advertisements in affiliated podcasts, blogs and emails. Inclusion of such advertisements does not constitute or imply endorsement, sponsorship or recommendation thereof, or any affiliation therewith, by the Content Creator or by Ritholtz Wealth Management or any of its employees. Investments in securities involve the risk of loss. For additional advertisement disclaimers see here: https://www.ritholtzwealth.com/advertising-disclaimers Please see disclosures here: https://ritholtzwealth.com/blog-disclosures/
What's been said:
Discussions found on the web:Posted Under
Previous Post
Structural Changes at S.E.C.

2014: Barron’s Michael Kahn says: Gold: It’s Time to Buy
http://www.barrons.com/articles/gold-its-time-to-buy-1416432694
Over the years, I have made some bold calls on gold and often the pushback from those not sharing my views has been rather vigorous, to put it mildly. It’s time to once again risk the wrath of the haters and say that gold finally looks ready for a recovery.
No, I am not saying it is heading back up to its 2011 peak above $1,900 an ounce, at least not for the foreseeable future (it traded at $1,195 Wednesday afternoon). However, I do think in the long term we will see an important bull market return.
For the here and now, a potential reversion back to its 200-day moving average in the $1,250 area would indeed be a good first step on the road to serious recovery. If and when it gets there, we will likely see the chart set up for a run back to $1,500. We’ll look at that chart below.
Simple Enough: Commodity Research Bureau (CRB Index Level) Date
473.52 Thurs. 07/03/2008
312.93 Fri. 06/20/2014
184.12 Thurs. 11/19/2015
Oil was @ $145.29/bbl. on that date in 2008. It was @ $106.05 in June ’08 and yesterday the December contract settled @ $ 40.54. But, oil is only a part of the story. The usual correlations are skewed just as they are in liquidity, supply/demand, interest rates, and in 50 years, looking back, however this distortion unwinds, people will ask: ‘was that the period when the so-called “free market” was dissolved’? The Fed (fiscal) interference is monumental; the failure of the Republicans to help govern the economy (monetary) seems more 19th Century than the 21st global economy. These people in D.C. had better awaken and realize they have a role to play in a planetary complex w/ over 7.2 billion souls leaning into the #1 economy w/ a GDP somewhere in the $20 T. range.
Three years earlier in 2005, the formerly equal-weighted CRB index (in which crude oil had a 5.9% weight) was revised to give crude oil a 23.9% weight, and energy overall (including heating oil, unleaded and natgas) a 39% weight.
This seemed like a clever move during a huge crude oil rally. But it resulted in the CRB index being crushed after mid-2008.
Meanwhile, the earlier equal-weighted index carries on as the CCI (Continuous Commodity Index), and an ETF (symbol GCC) tracks it.
My trend-following indicator for CCI hasn’t turned up yet. And it probably won’t as long as a strong dollar keeps commodities under pressure. But every dog has its day.
The Baltic Dry Index is setting new lows. http://www.bloomberg.com/news/articles/2015-11-19/baltic-dry-ship-index-drops-to-record-as-iron-ore-growth-slump
I assume these are all signs of continued global economic growth with the US consumer in the lead with consumers in other countries working hard to catch up. The stock market can only go up from here.
They increase in the supply of commodities has been bad for commodity producers and their financiers.
It’s good for everybody else.
Enjoy.
It’s called mean variance optimization for a reason.