
What happens when you analyze federal data comparing income versus net worth?
The R-squared value, a measure used to express the relationship between two sets of data, is only 33%. In other words, one variable only helps to “explain” the other about a third of the time, which suggests just a partial relationship between income and net worth.
While that may seem counterintuitive, wealth is a function of numerous elements:Beyond income, there is spending, savings, investments, stock option compensation, business ownership and more.
Source: Don’t quit your day job via Visual Capitalist
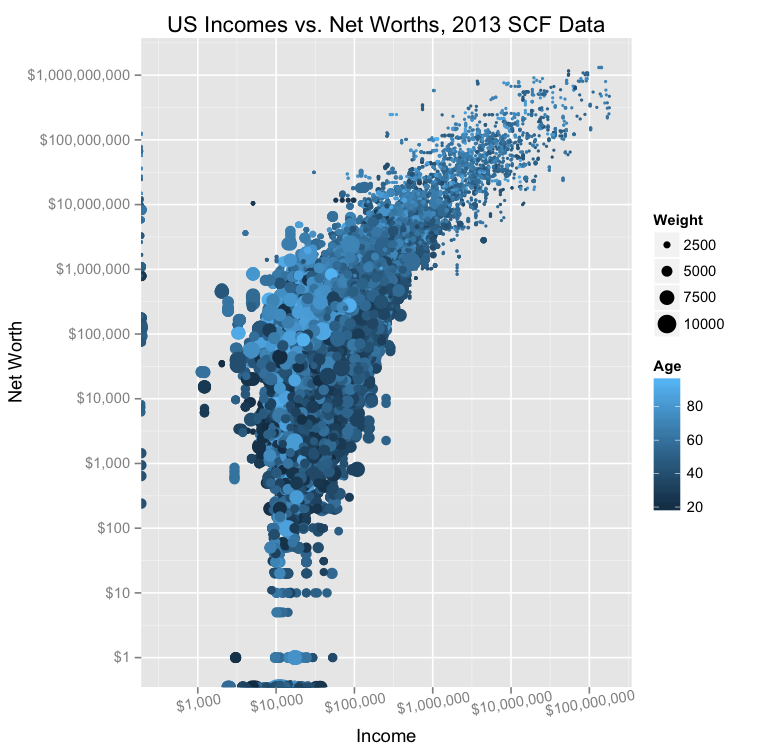
Chart: X axis = annual income; Y axis = net worth.
(logarithmic scale, intervals increase by a factor of 10x).
