
Source: How Much
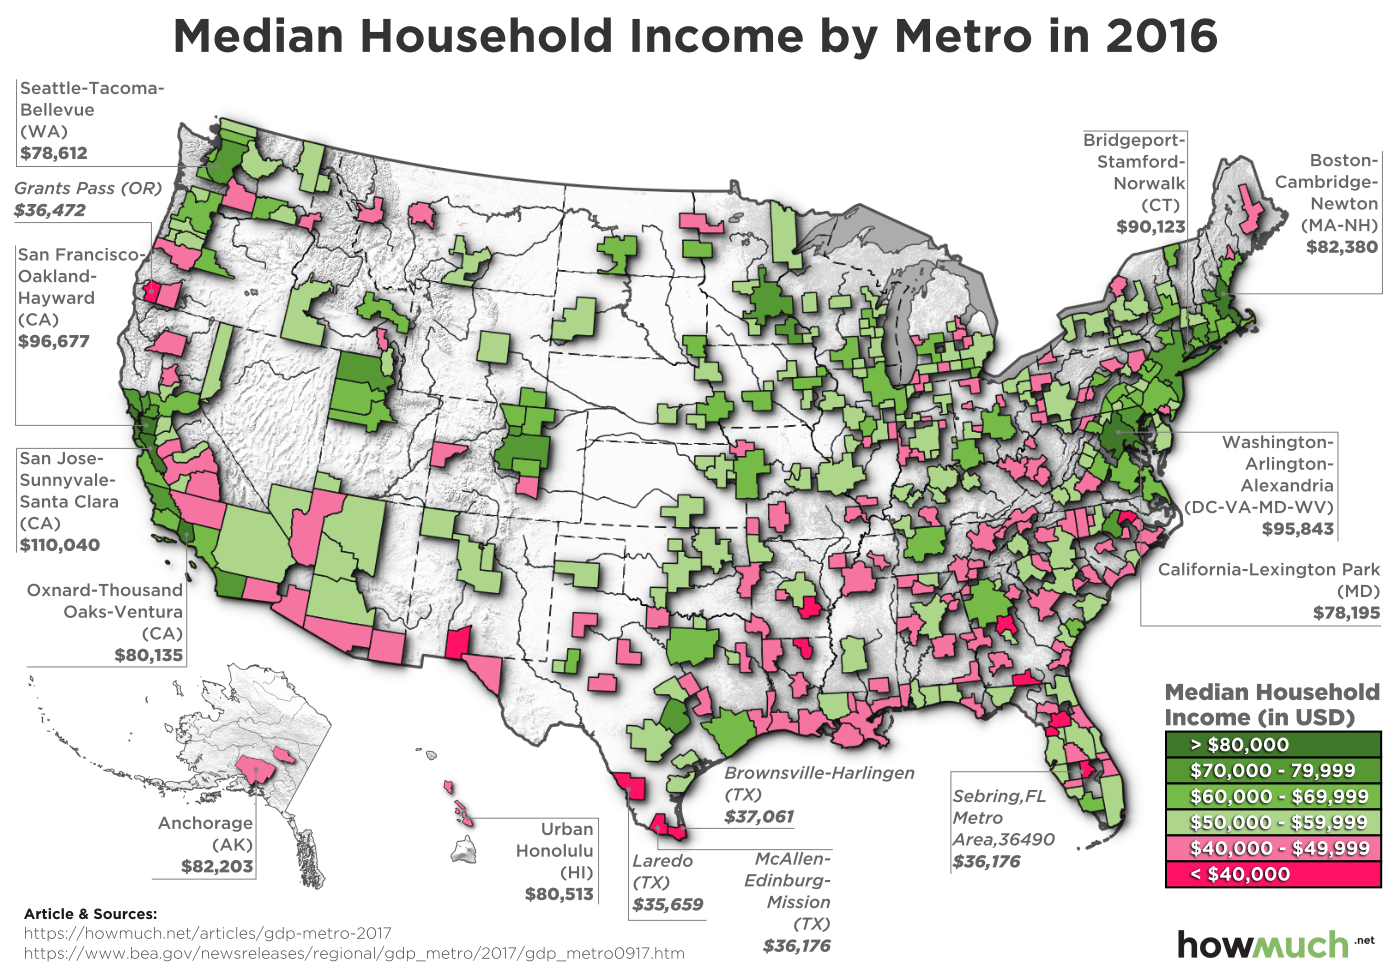
Income data for the last full calendar year is depicted above. I am really enjoying the maps another infographics from How Much — they are not perfect, but they do a decent job in showing broad economic trends.
The belts of wealth and poverty can be seen above via Census Data for all 382 metropolitan regions. The east and west coasts have lots of high earners; the south east farming belt fell way behind . . .
