
Taking Stock of a Very Weird Year in Markets
Rarely have investors had such consistent, steady gains. That bodes well for the future.
Bloomberg, January 3, 2018, 11:32 AM EST
Last year was just plain weird. I am not referring to politics, although that certainly was one for the ages. Rather, I mean the technical state of the markets. No matter where you looked, there were anomalies, aberrations and just plain weirdness going on.
But hold these non-quantitative aspects aside. Our charge today is to review some of the more notable technical oddities. Perhaps we might even learn what this strangeness means for investors in the future.
Let’s take a closer look at the past year:
• Overseas Trounces U.S.: This was a notable performance metric. 2 Although the Standard & Poor’s 500 Index had a good year, up 21.7 percent, the rest of the world beat the U.S. Europe had an even better year, with a 27 percent gain, while the Pacific region advanced 28.9 percent and emerging markets surged 37.4 percent. Even Japan, mired in slow growth for ages, outperformed with a 24.3 percent gain. A global economic recovery and improving corporate profits worldwide deserve the credit, not deregulation or tax cuts in the U.S.
• Volatility: A favorite theme of ours reasserted itself last year: Political volatility doesn’t equal stock-market volatility. Despite all of the political sturm und drang, be it North Korean missiles, health-care repeal drama, white nationalists is Charlottesville, Virginia, and too many other @realDonaldTrump tweets to keep up with, stock volatility was the lowest in a half-century. You have to go back to 1964 to find average daily change for the S&P 500 as low as it was in 2017. It wasn’t just the U.S.; the lack of connectivity between politics and equities in emerging markets saw those stocks ignore all manner of political crises as well.
I keep repeating this: politics and investing simply do not mix in any predictable, actionable way. Efforts to see investment themes in politics is an expensive indulgence, best avoided.
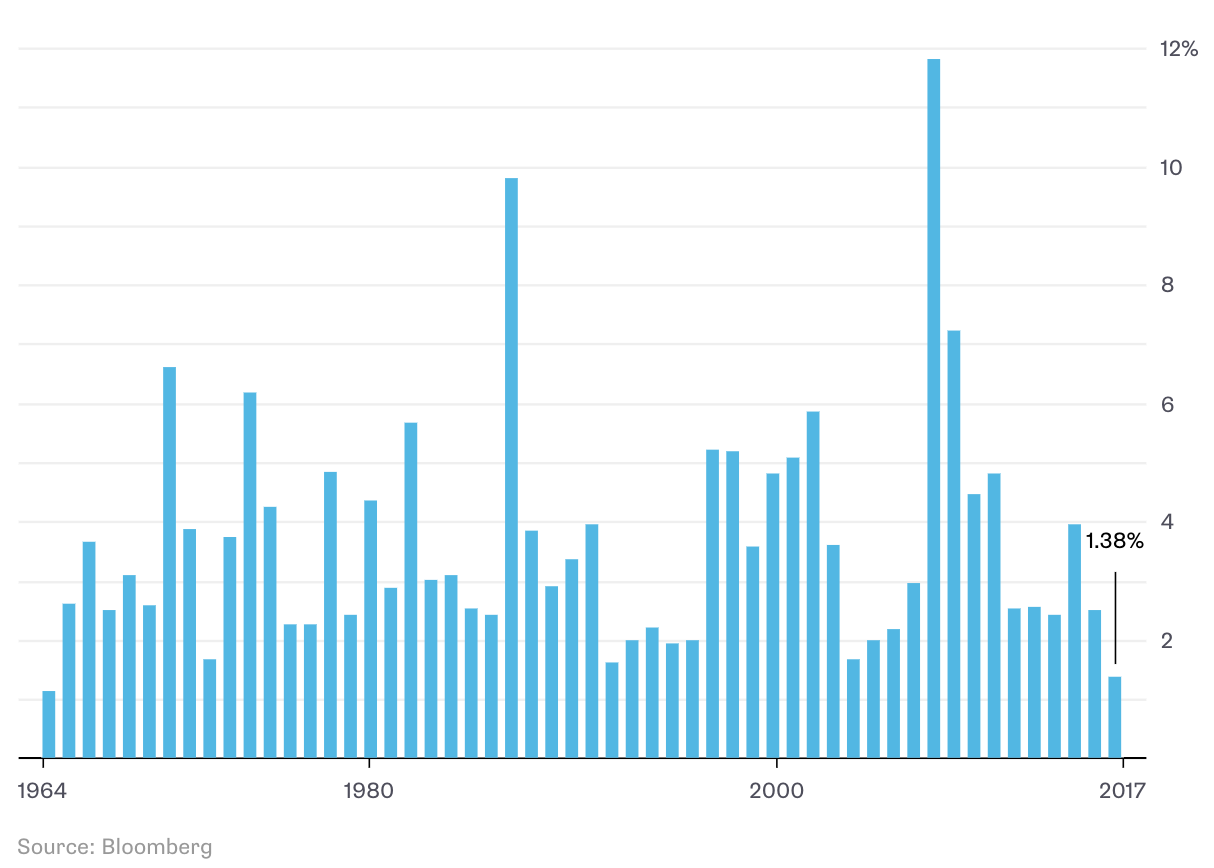
• Tepid Daily Gains: U.S. stocks were up more than 20 percent, but it has been a surprisingly slow, steady grind. The single best day for the S&P 500 in 2017 was a rise of just 1.38 percent. There just hasn’t been much in the way of giant euphoric gains of bull markets past. Small gains do add up over time; however, the lack of outsized single-day increases should make us question claims of reckless purchases and a stock-market bubble. See the following chart:
Maximum daily gain during the year in Standard & Poor’s 500
• Modest Declines: The flip side of the lack of big gains is the lack of big losses: the S&P 500 hasn’t closed 3 percent lower than its all-time high since the 2016 elections. This 14-month streak is the longest ever. The maximum decline during the year for the Dow Jones Industrial Average in 2017 was 3.4 percent. This is the second lowest for a single year ever, behind only 1995.
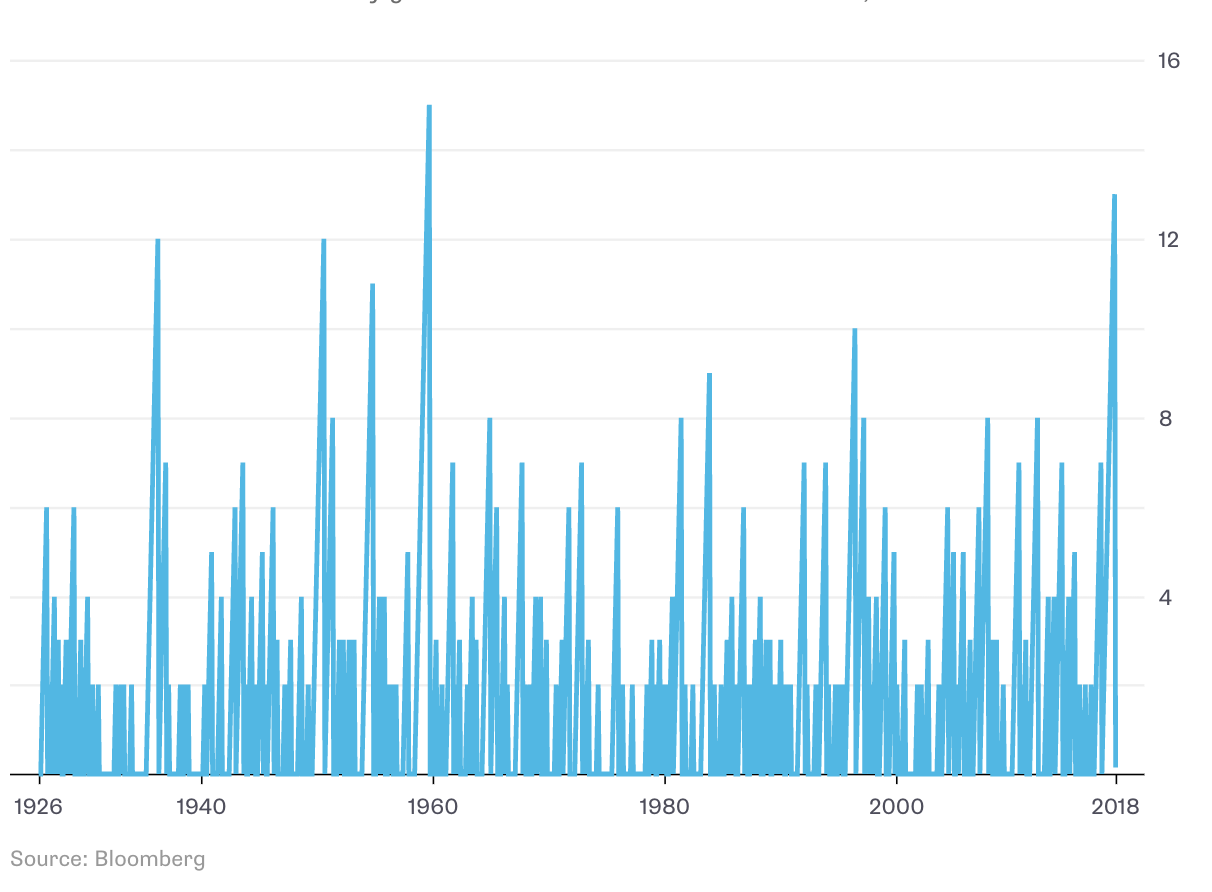
• Consecutive Positive Months: The S&P 500 was in the green each calendar month for 13 months in a row; the last time this happened was in 1959 (that run extended for 15 months, as the chart bellow shows). While this is unusual, I am not quite sure exactly what it
Number of consecutive monthly gains in the Standard & Poor’s 500 Index, total returns
• New Highs: Returns during that 13-month period were more than 27 percent. The average return during the five previous times where stocks had at least 10 consecutive monthly gains was 50 percent or more. Although stocks have gone up for a long while, they haven’t gone up that much. This is consistent with our earlier observation of a slow gradual grind higher.
• Moving Averages: The 200-day moving average has been rising every single day since May 2016. Momentum as the fourth Fama-French factor had a very good run last year. If you are looking for anything to make you bullish, it is this sustained trend.
Looking at all of these oddities combined,3 it suggests to me that investors remain flush with cash worldwide; that institutional investors believe stocks are their most attractive option for that cash. Last, that the secular bull market that began in 2013 (and not 2009) still has a way to run.
Originally: Taking Stock of a Very Weird Year in Markets
