Source: New York Times
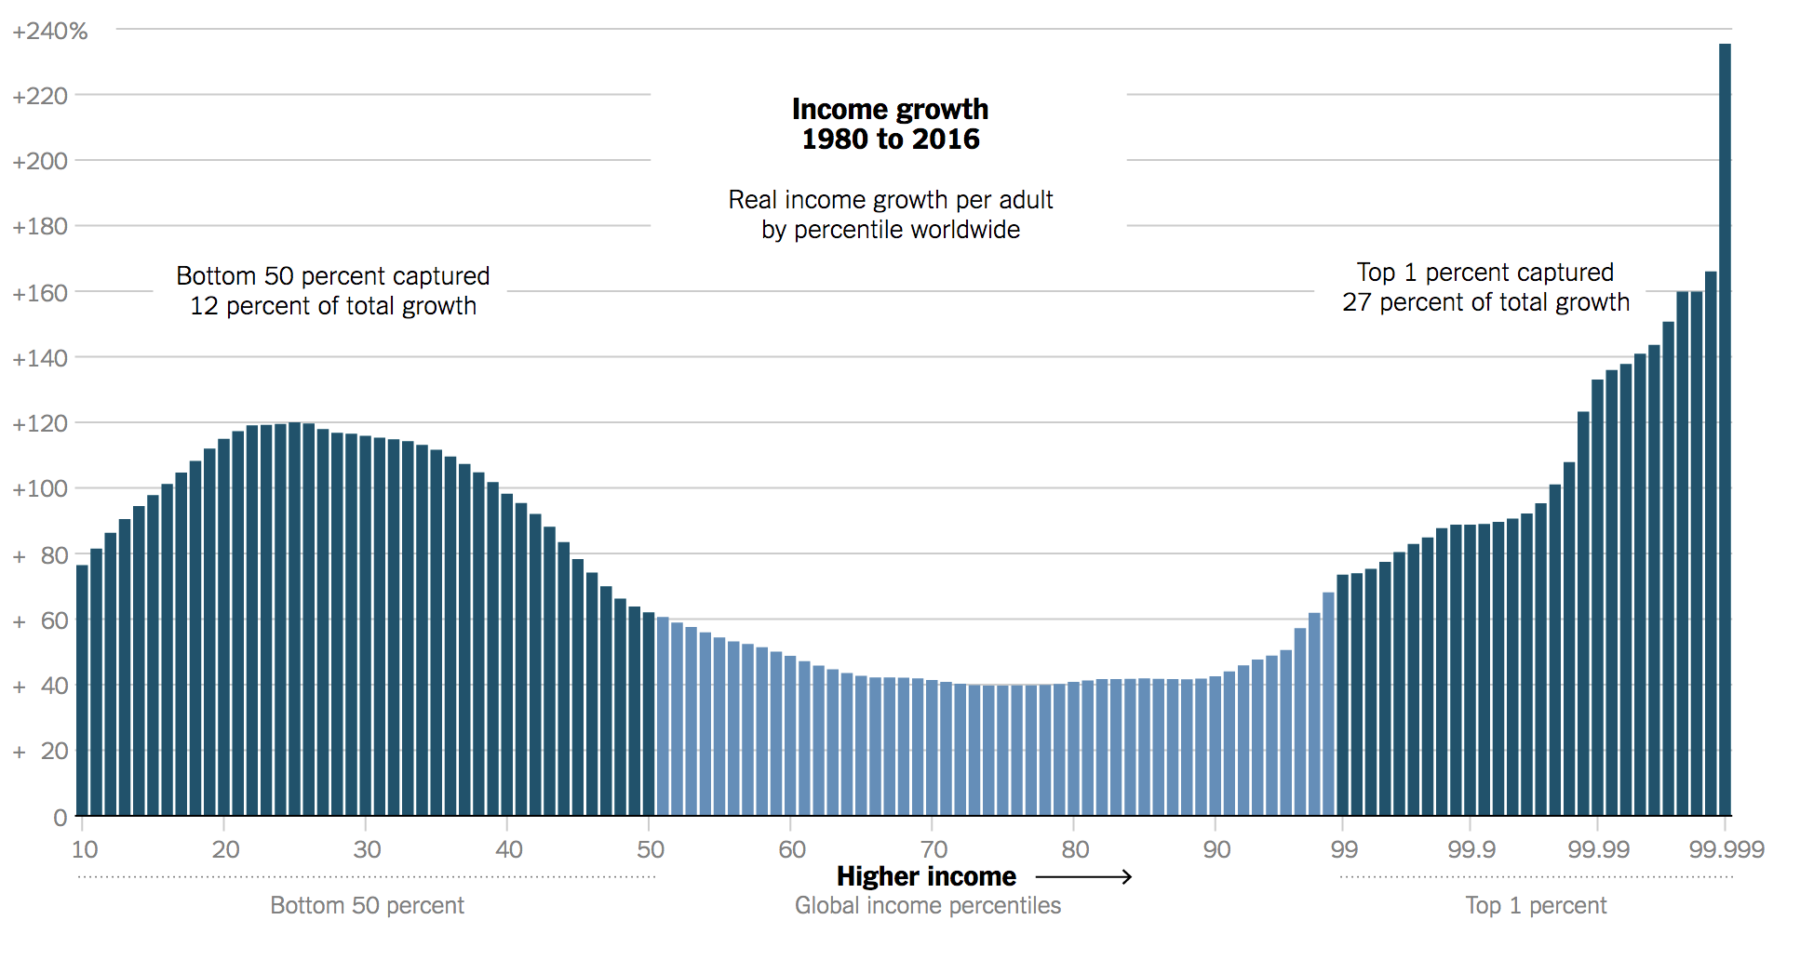
While researching No, Your iPhone Does Not Make You Wealthy, I found this really interesting chart (above). It shows how much global economic growth has fallen to each income group. It is sliced (stratified is the technical term) a mere 1% at a time.
I guess we should not be too surprised by the details: The bottom half of the population accounted for only 12% of the income gains since 1980. The top 1% captured 27% of the gains.
Perhaps most fascinating is the middle and upper middle: the trough from the 50th to 90th percentile goes along way in explaining the rise of popularism around the world, from Brexit top Trumpism to burn it all down and start over.
NYT:
“Examining the “World Inequality Report” — published Thursday by the creators of the World Wealth and Income Database, who include the economists Thomas Piketty and Emmanuel Saez — it is tempting to see the rising concentration of incomes as some sort of unstoppable force of nature, an economic inevitability driven by globalization and technology. The report finds that the richest 1 percent of humanity reaped 27 percent of the world’s income between 1980 and 2016. The bottom 50 percent, by contrast, got only 12 percent.
Nowhere has the distribution of the pie become more equitable.”
Fascinating . . .

