
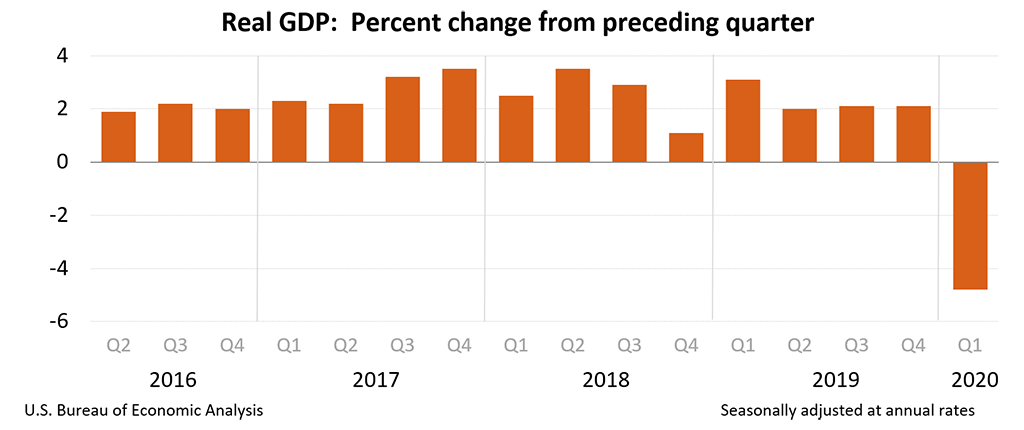
Source: BEA
Yesterday’s column about why inflation is not a serious threat was based on the premise that GDP has gone negative, household demand has plummeted, and neither is liekly to recover anytime soon to 2019 levels.
The unanswered question is exactly how much has GDP fallen?
Sequentially, BEA reports Q1 GDP decreased at an annual rate of 4.8%. Q4 2019 real GDP increased 2.1%. That is a 6.9% swing from Q4 to Q1. And thats a quarter where the shut down was barely in effect for 1 month.
What happens now that May is the 3rd month of shutdown? What might annualized GDP be today?
To answer that question, let’s do a thought experiment: Based on recent U3 Unemployment data, let’s extrapolate what Gross Domestic Product might be.
During Q1, we barely had a single month of lockdown — it was most of March 2020. If we had a full quarter of lockdown, that would make GDP worse — close to 3x worse. The lockdown has most of March, all of April, and (so far) the beginning of May. Extrapolating from the “advance” estimate of Q1 GDP data, we can easily surmise annualized GDP in Mach April and May is down 8-10%.
What about unemployment data? It has been quite literally, “off the charts.” Can we deduce what GDP is from the number of people filing for unemployment claims or as measured by BLS Employment Situation report?
The 2008-09 crisis saw unemployment fall to 10% — and that was a GDP of minus 4%. We are at now at a 14.7% unemployment rate, according to BLS, who also noted that there may be as many as another 5% of uncounted unemployed. Let’s round that up to ~20%.
Assuming the relationship between U3 and GDP is linear (and not worse), this suggests a minimum fall of GDP of double what we saw in 2008-09. That puts us at least over -8%, perhaps closer to -10-12%.
But it is worse than that: People have been unable to get thru to State Unemployment office for weeks who have not been able to file first time Unemployment claims. Now add in the Gig Employees, other independent contractors, and others. The true U3 Unemployment is closer to 25-30% than 20%. A fair range of GDP decrease is now closer to -12-15%.
Next, add in millions who didn’t actively search for new jobs because, well, there aren’t any (so they didn’t make the official data). Could we bump GDP towards a -15-20% range?
It is certainly is a mathematical possibility.
~~~
That is my lazy thought experiment, working from a single input (UnEmployment) into GDP. The proper way to do this is to model the economy using as many reliable data sources as you can find: Consumer Spending, Business Investment, Savings Rates, Durable goods purchases, etc.
I don’t maintain a full model of all economic inputs, but I know lots of folks who do. I’ll reach out to a few of them to learn what their models are showing . . .
