
Home Price Changes, U.S. Cities, 2000-2020
click for interactive graphic
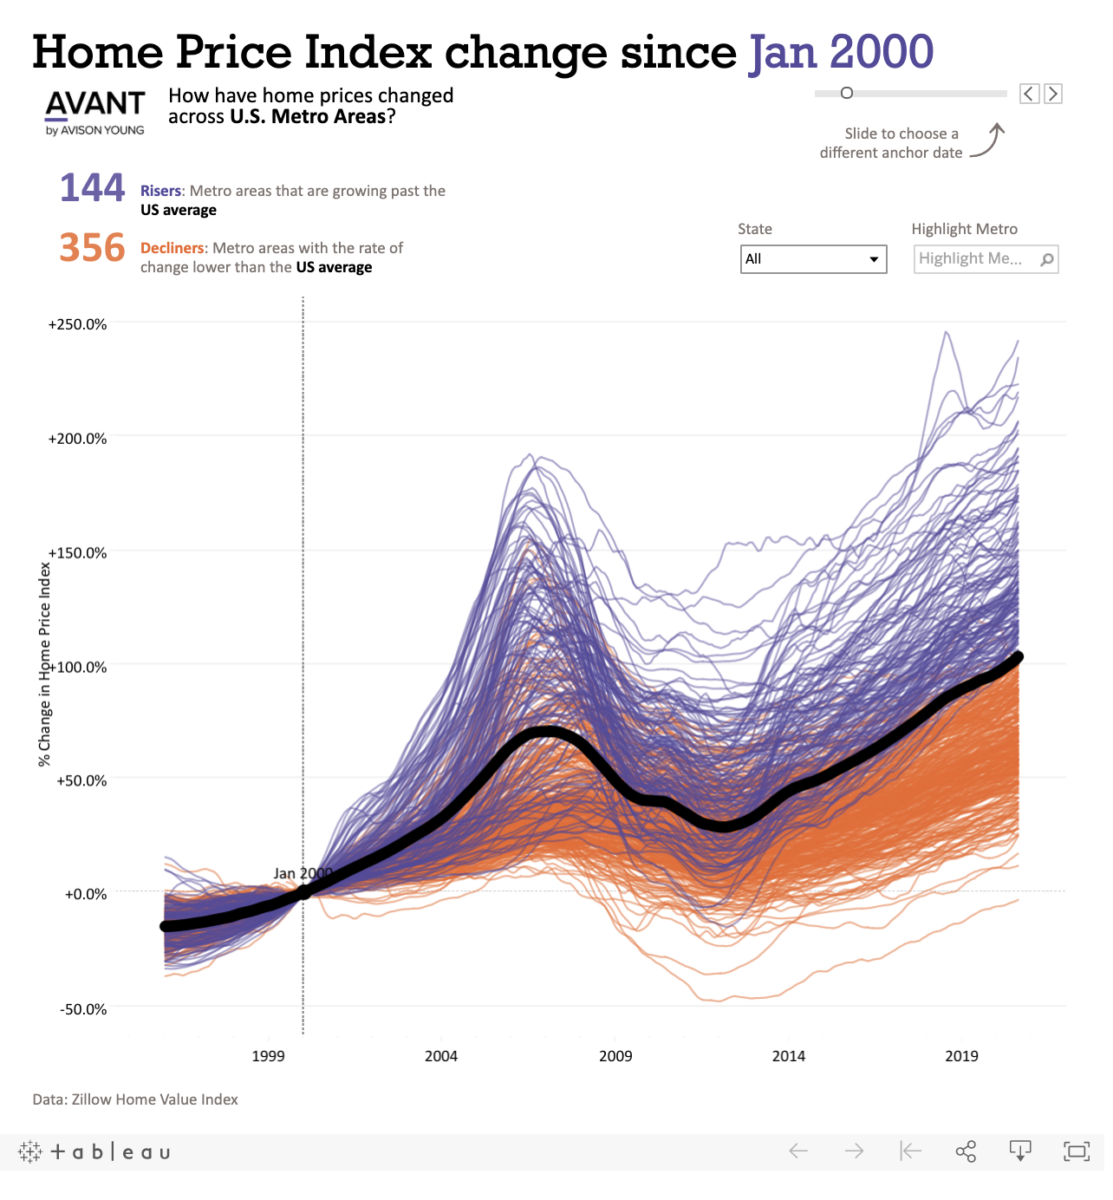
Source: Visual Capitalist
I am a sucker for any sort of interactive graphic that can reveal insights that may not be obvious about broadly owned assets. Play with the Visual Capitalist graphic above for a few minutes and you will see exactly what I mean.
The torturous path of real estate prices in the US epitomizes this idea: House prices are driven by the complex combination of mortgage rates, wages, employment and your local economy. As those have fluctuated in response to both ordinary economic cycles and extraordinary crises, real estate has been on quite the rollercoaster this century as seen here.
The average U.S. home value in 2000 was $126,000. That figure has risen to a record high during the pandemic in 2020 of $259,000. That’s a robust 106% increase over two decades.
My friend and real estate rabbi Jonathan Miller observes: “The initial wave began with “panic buying” and a literal flight to safety. In New York City metro suburbs — Westchester, Fairfield and Nassau counties — bidding wars account for roughly 30% of the sales with listing inventory at or near record lows.” And I agree with his assessment of how we got here, but going forward is a bit of a jump ball.
My contrarian take: Mortgage Rates are as low as they have ever gotten; pandemic driven demand to move from tight apartments with shared lobbies and elevators in urban centers to more spacious suburban homes with yards is at its peak. Recent price gains puts houses in the upper range of affordability.
We may be approaching peak suburban home price soon . . .
