
The Standard & Poor’s 500 stock market index tracks ~$45 trillion dollars in US Equities. It is a key component of numerous portfolios and looms large as a benchmark for many fund managers. To say it is an important index wildly understates its significance.
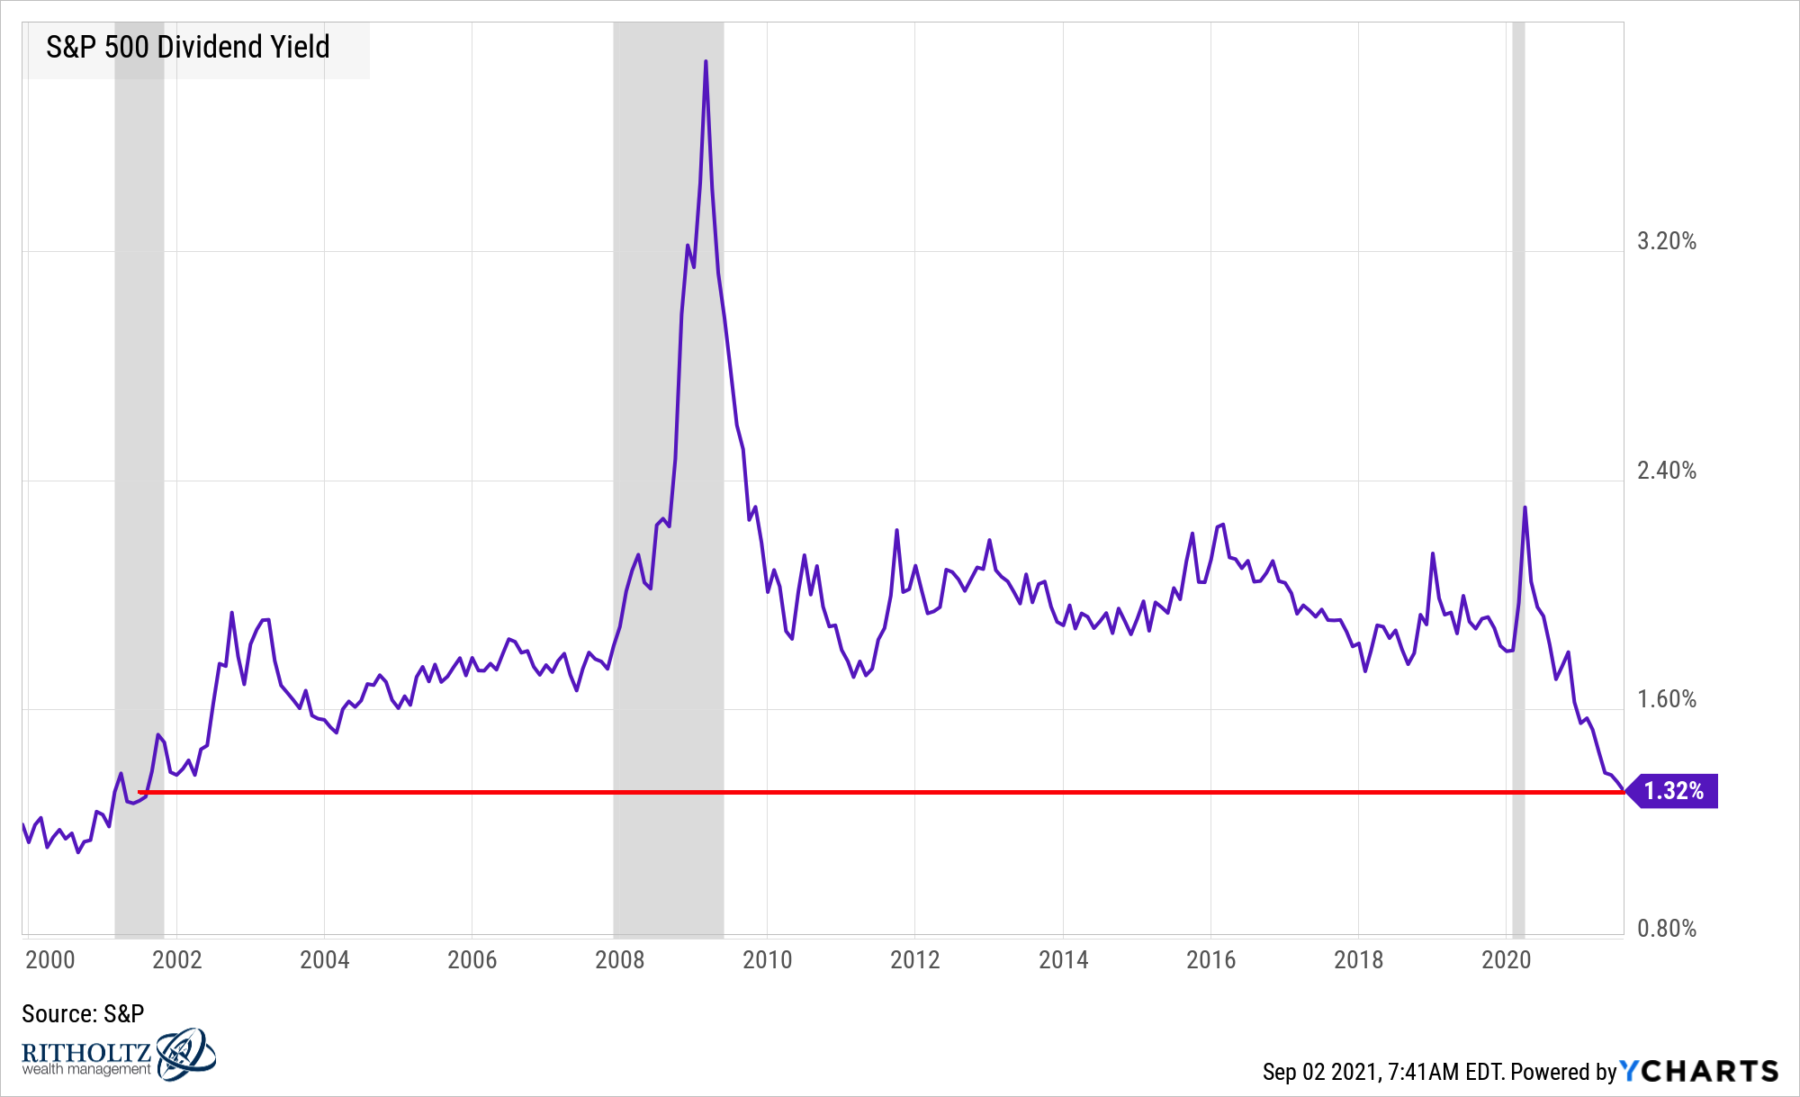
The dividend yield of the S&P500 has spent the past decade (the 2010s) averaging around a ~2% yield. This yield has made it part of a trend towards higher equity exposure as a way to make up for lower bond yields. Making stocks a bond substitute(!?) has had a few direct and interesting results:
1. 60/40: The traditional 60/40 portfolio has become more of a 70/30 or even 75/25 mix of stocks and bonds. This trade-off includes 1) an increase in volatility and drawdowns (though not this year); 2) higher expected returns; 3) an increase in total portfolio risks.
2. Valuations have risen, and U.S. stocks are fully if not richly valued (the nature of bull markets is for valuations to rise, and P/E multiples to expand. This quarter has seen record profits, with about 80% of the SPX reporting
3. Inflows: With a few notable exceptions, capital has continued to flow put of actively managed funds and towards passive indices. This is another driver sending yields dividend lower.
4. Default? For many, the S&P500 has become the default setting for where to sweep new cash and other unallocated capital.
5. Streak: 2021 has seen 7 consecutive monthly gains in the index, the longest such streak since December 2017.
6. Higher Yield: Before the 1990s, the S&P 500 yielded 3% or more and topped 6% at a market low in 1982. This was an era of higher bond yields (Barron’s)
I do not know how this manifests in the future in terms of market risk. That impact has yet to be determined. But anytime I see a market indicator hit a 20 year high or low, it is worth taking note of as it has the potential to be reflecting significant and ongoing trends.
~~~
Chart courtesy of YCharts
