
Any attempt to depict the universe with only symbols and numbers runs into an obvious challenge: It is almost it is all but impossible to create a perfect construct abstractly.
But we can create models that are good enough to allow us to analyze the world. We can find interesting correlations, and occasionally causations, and can develop a better understanding of the ways different variables interact. We can even develop toolsets that provides insight into the near future based on the recent past.
This is what led British statistician George E. P. Box to declare “All models are wrong, but some are useful.” Box understood that models need not be perfect to serve as useful tools. Legion of analysts, economists, and portfolio managers who use them agree.
I have been a critic of CPI for a long while, and why it is important to understand the “Wrong” part, it is just as important to understand the “Useful” parts, too.
In the gap between objective reality and the models that depict them lay a world of confusion: This is where conspiracy theories are born, where those married to outdated ideologies live, and where charlatans thrive.
We have discussed how the official CPI basket of goods often understates inflation. This was purposefully the goal of the 1995 Boskin Commission, charged with revising the Bureau of Labor Statistics inflation measure. It was a dishonest, partisan way to lower inflation readings to reduce the cost of living adjustments (COLAs) for Social Security and other government spending.
My favorite example is “substitution” — the idea that e.g., people will switch to less expensive chicken when beef prices rise. The reality is that inflation has priced consumers out of steak; Substitute tells us about behavior, not price inflation. We have also delved into OER and why sometimes, Housing can be a challenge for inflation modeling.
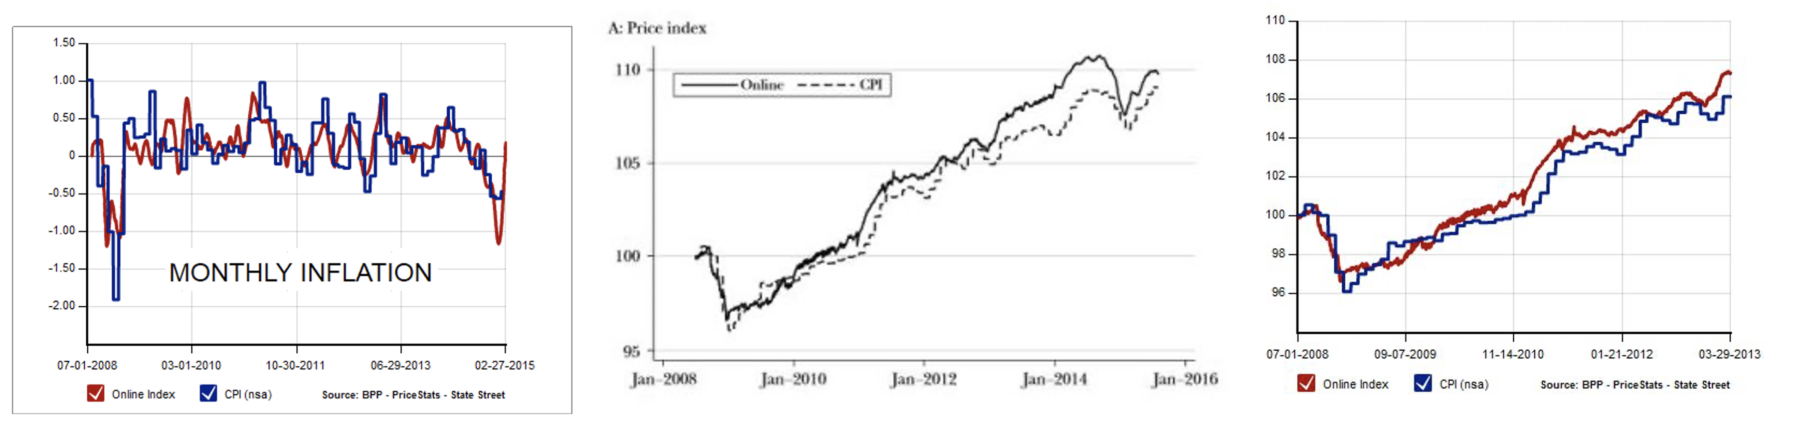
And yet, for all of its flaws, CPI does a pretty good job measuring inflation. Just look at the Massachusetts Institute of Technology’s Billion Price Project (BPP), which monitors daily price fluctuations of ~15 million items sold by +1000 online retailers in more than 70 countries. It runs fairly parallel to CPI, as seen in the three charts (above).
The challenge today is the shift from a mostly Services (63%) economy pre-pandemic to the substantial above normal weight of Goods consumption during the 500 days of pandemic lockdown, to a slowly normalizing mix of both Goods and Services.
During the pandemic era, we likely pulled forward many good purchases from 2022-24 into 2020-21. This could be a factor in why some of the retailers are coming up short in their earnings reports. (more on this soon)
Meantime, Inflation has likely peaked and will likely be heading lower over the rest of the year. (How much longer the Russian War in Ukraine lasts may also be a key factor).
See also:
Why Has the Inflation Calculation Changed Over Time? (NYT, May 24, 2022)
Where Is Inflation Headed? Nine Signs to Watch (WSJ, May 24, 2022)
Previously:
Transitory Is Taking Longer than Expected (February 10, 2022)
Deflation, Punctuated by Spasms of Inflation (June 11, 2021)
What Models Don’t Know (May 6, 2020)
Inflation Is Not a Problem (Yet) (June 25, 2018)
Confessions of an Inflation Truther (July 21, 2014)
Is Inflation Really Understated? (No!) (May 08, 2008)
Ex-Inflation, There is No Inflation (September 26, 2005)
How Housing Lowers CPI (May 21, 2005)
Fun with Hedonics or: “How I learned to stop worrying about CPI and love inflation.” (April 21, 2004)
No, Your iPhone Does Not Make You Wealthy (June 4, 2018)
