
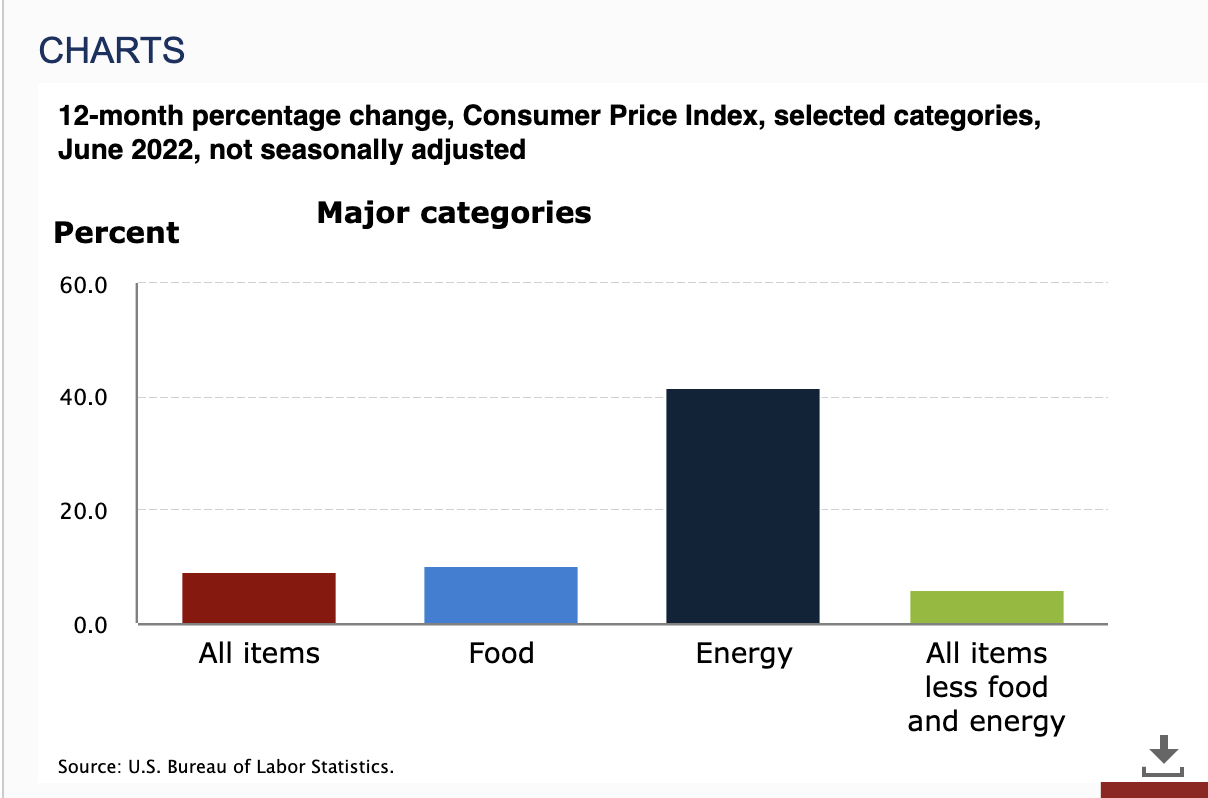
The CPI data came out today sizzling hot at 9.1%: “Over the last 12 months, the all items index increased 9.1 percent before seasonal adjustment.” That’s the highest print since December 1981.
These 40-year highs reflect broad increases in Services, Rent, Food, but most especially Energy. The BLS chart above shows how much Energy has risen over the past 12 months, driven mostly by Gasoline, Crude Oil, and Natural Gas.
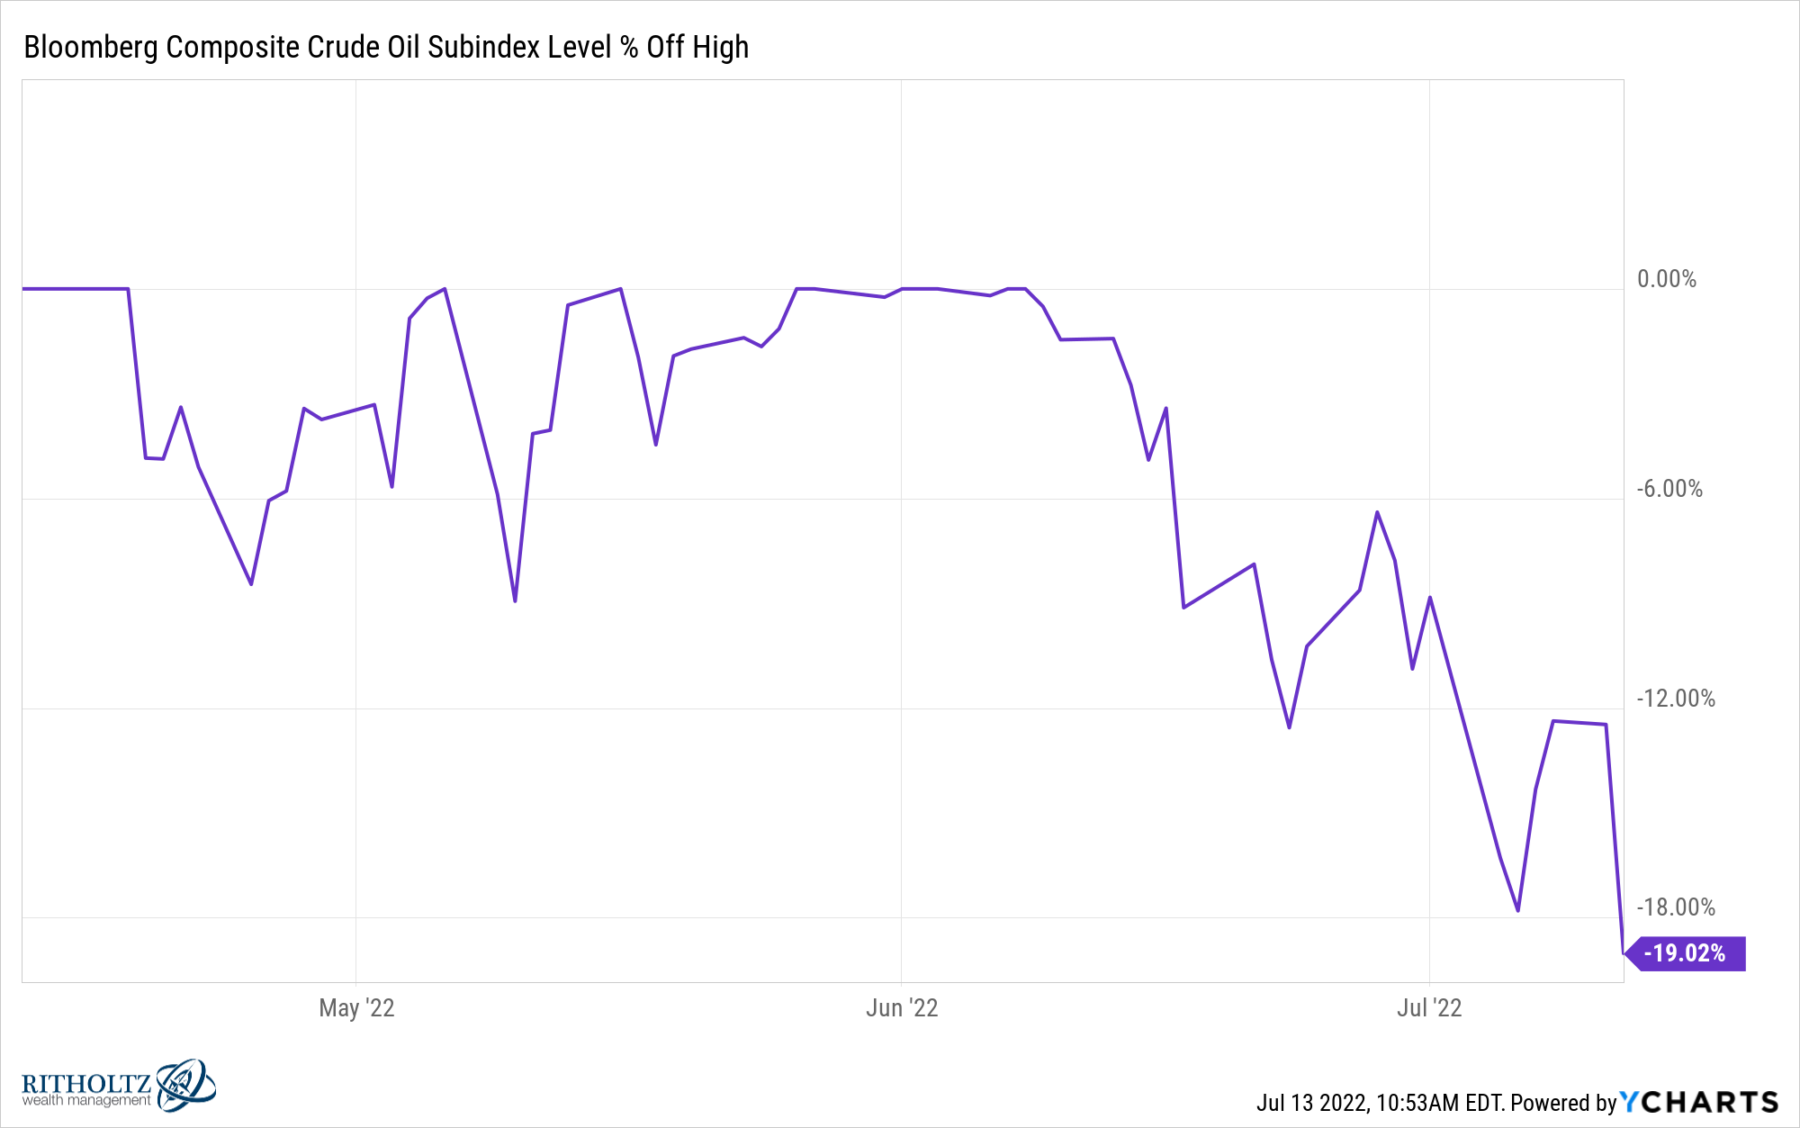
But here is the thing: That information was collected over the course of June — meaning, it is already 14 to 44 days old. And since early-June, we know that energy prices have fallen substantially: Gasoline has fallen 24 consecutive days, dropping back under $5 a gallon; Crude Oil, which ran up to $120 last month, is now back under $100 — last print was $96.
These are up substantially from a year ago but as the charts below show, they have fallen about 20% since last month.
I do not know for sure when the data will fully reflect the decrease — July (August release), or August (September release) but one would expect to see these falling prices show up sooner rather than later.

The wild card to me about CPI is no longer Goods but Services.
The data makes it clear that Goods in general but especially Commodities have seen the worst of this, and are beginning to ease in price.
Services, on the other hand, are much harder to pierce. Rent price increases tend to be sticky, and we will soon find how much pricing power landlords have following two years of eviction moratoriums and lowered rental demand. And Medical costs are another price issue.
~~~
Now we wait to see what the Fed does July 27 + 28 but 75 bps seems to be baked in. CPI for July 2022 is scheduled to be released on Wednesday, August 10…
Previously:
Revisiting Peak Inflation (June 29, 2022)
Who Is to Blame for Inflation, 1-15 (June 28, 2022)
Has Inflation Peaked? (May 26, 2022)
Goods Versus Services (June 3, 2022)
