

There is a particular type of analysis I keep seeing, one that easily misleads investors. Typically, it starts with an important, single data point — but lacks context. It is an oversimplification of a market complexity that can easily lead to an incorrect conclusion.
Lately, Excess Savings is a perfect example of how a lack of context can affect your thinking.
Excess No More? Dwindling Pandemic Savings
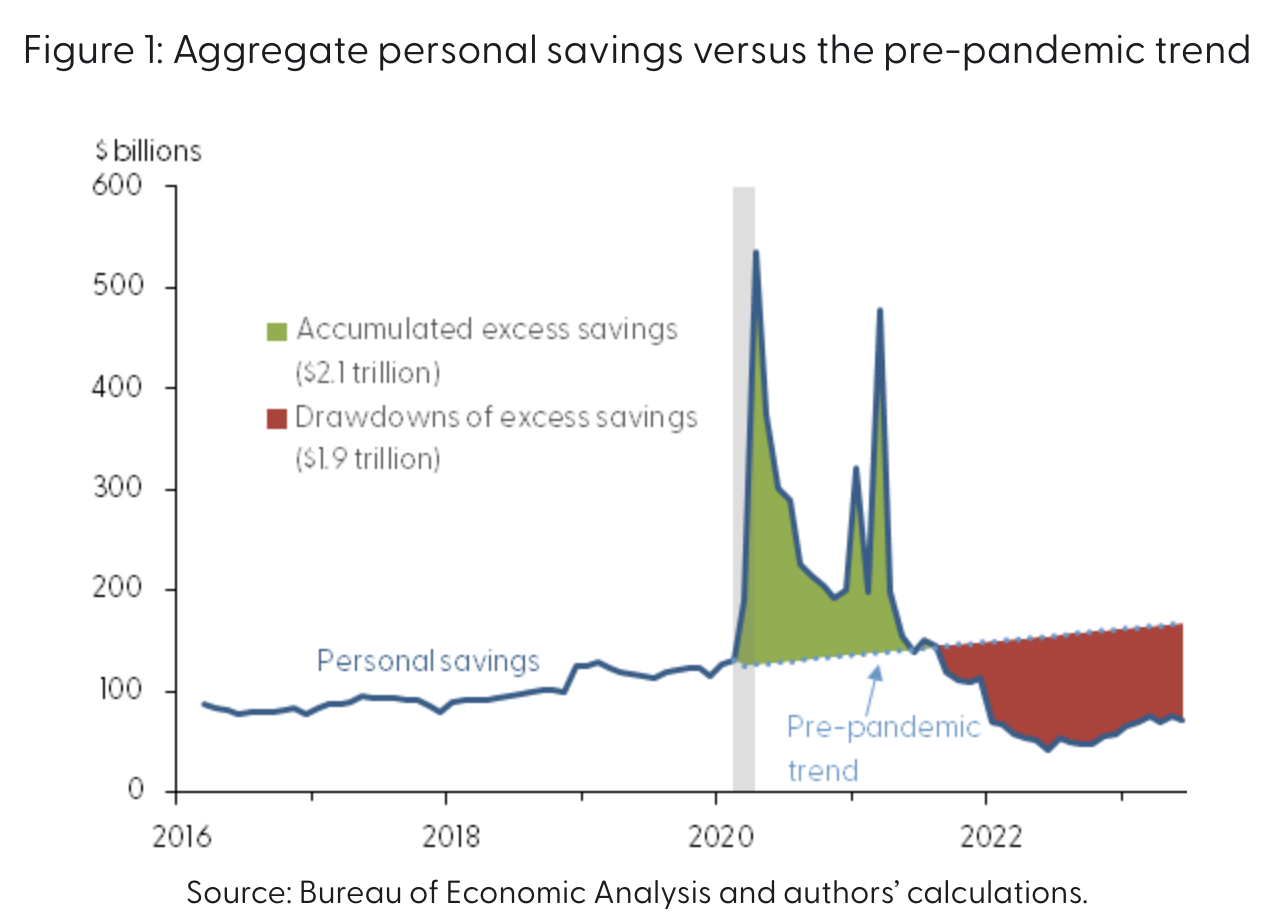
Source: Federal Reserve Bank of San Francisco
All of the chatter about how far excess savings have fallen — see, e.g., this, this, this or this — ignore the source of much of those dollars: Government transfers during the pandemic. They also forget that people were locked up inside for 2 years. They had “Cabin Fever,” and not surprisingly, all of that pent-up demand came out as a surge in consumption, especially recreational summer travel. A little craziness is to be expected, but we should be careful of extrapolating from what looks like a one-off, post-lockdown bacchanal.
It reminds me of a bad syllogism:
Observe a Single Data Point;
Reach a broad conclusion about it;
Express this in a trade or investment idea
The problem with any single data point is that the real world is complicated, messy, and filled with randomness and noise. When any new economic release comes out, you really don’t know how much is noise and how much is signal.
If you learn how to properly frame data, you can avoid errors of this kind. It’s not just newbie investors who fall prey to this; I see it repeated in the financial media all too often. And it is more than just the recency effect (see this for more on that bias); really, we all need to learn how to contextualize data within both the bigger picture and over the fullness of a time.
Economic data is especially noisy, subject to revision, and based on models that are “wrong but useful.” More importantly, most are part of a data series which over time can form a trend.
And there are always a lot of swings around that trend line: Normal volatility, pullbacks, and sudden price surges are all the normal meanderings of a price series. My colleague Josh Brown uses the metaphor of a guy walking a dog through a park – the path of the person is the trend, but the wild back and forth of the dog at the end of the leash is the price series.
I like that analogy, because it forces you to step away from a single moment, zooming out to see the broader context. Instead of thinking about any specific price or data point by itself, try envisioning that price within the longer data series. It’s more about seeing the video of an event rather than looking at a single still image. As I like to call it, its Flix versus Pix.
Thinking about the trend avoids overreactions. Using a trendline or moving average can apply to any sort of data series. The 3-month moving average removes much of the noise from NFP reports; 6-month trends gets past the regular revisions and updates in everything from Consumer Spending to CapEx. Want a half-decent sell signal in equities? Ignore the strategists’ reports and try a 10-month moving average on NDX or SPX.
The advantage of a trendline is it compensates for the inherent weakness of models. The noise, revisions, updates, and even model changes all kinda sort themselves out eventually. They are imperfect depictions of reality, but if they are consistent, they can provide a useful framework for directional changes.
People with investment horizons of years or decades should avoid getting pulled into very short-term news. This includes the monthly employment situation report and quarterly GDP releases.
The long term is a series of short terms. Never confuse the two…
Previously:
What Models Don’t Know (May 6, 2020)
Confessions of an Inflation Truther (July 21, 2014)
Things I Don’t Care About (January 15th, 2013)
More Signal, Less Noise (October 25, 2013)
The Price of Paying Attention (November 2012)
Is Inflation Really Understated? (No!) (May 08, 2008)
Lose the News (June 2005)
Fun with Hedonics or: “How I learned to stop worrying about CPI and love inflation.” (April 21, 2004)
__________
1. Since this rhymes, it has to be true! That’s why I didn’t use: “Still Images vs. Moving Pictures”
