 In the week ended Wednesday, stock funds had net cash inflows of $1.7 billion, according to AMG Data Services. Money-market funds pulled...
Read More
 As part of a continuning series of academic fisking, let’s have a go at a pair of charts based on data from Yale Prof Robert...
Read More
 John Kuran points us to a study on Stock Market Extremes and Portfolio Performance. click for larger graphic Graphic courtesy Towneley...
Read More
 This chart has been used primarily as an excuse for bad investment advice: Source: Marketwatch Why an excuse? It builds in an out for the...
Read More
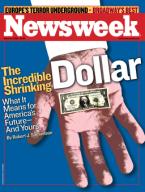 Here’s a (belated) recognition of a contrarian signal: The Magazine Cover indicator “The Incredible Shrinking Dollar”...
Read More
 I got my first iPod (a Press loaner from Apple) the first week they came out. It was a transcendant experience, and I pounded the table...
Read More
 Doug Kass over at Street Insight mentions that: "With economic tailwinds now becoming headwinds, one can only infer...
Read More
Each December, we pen our market expectation for the upcoming mid-year and year-end. Every quarter, we like to revisit those views,...
Read More
 Monthly momentum (blue circle) is turning down for the first time on the Bank Index since 2001. Philadelphia KBW Banks Index (BKX)click...
Read More
 Nasdaq hits 2005 in 2005!click for larger graphic Here’s looking forward to that .001% appreciation for 2006 for 2006. Want to know...
Read More
