
Via Credit Suisse
Meb Faber’s Idea Farm reminds us that the Credit Suisse Global Investment Returns Yearbook 2018 should be on your regular reading list. It is chock full of wonderful charts and tables and notes.
Two images from it struck me as so very insightful and revealing, they were worth sharing; perhaps because we have been discussing the issue of overseas exposure so much the past few years.
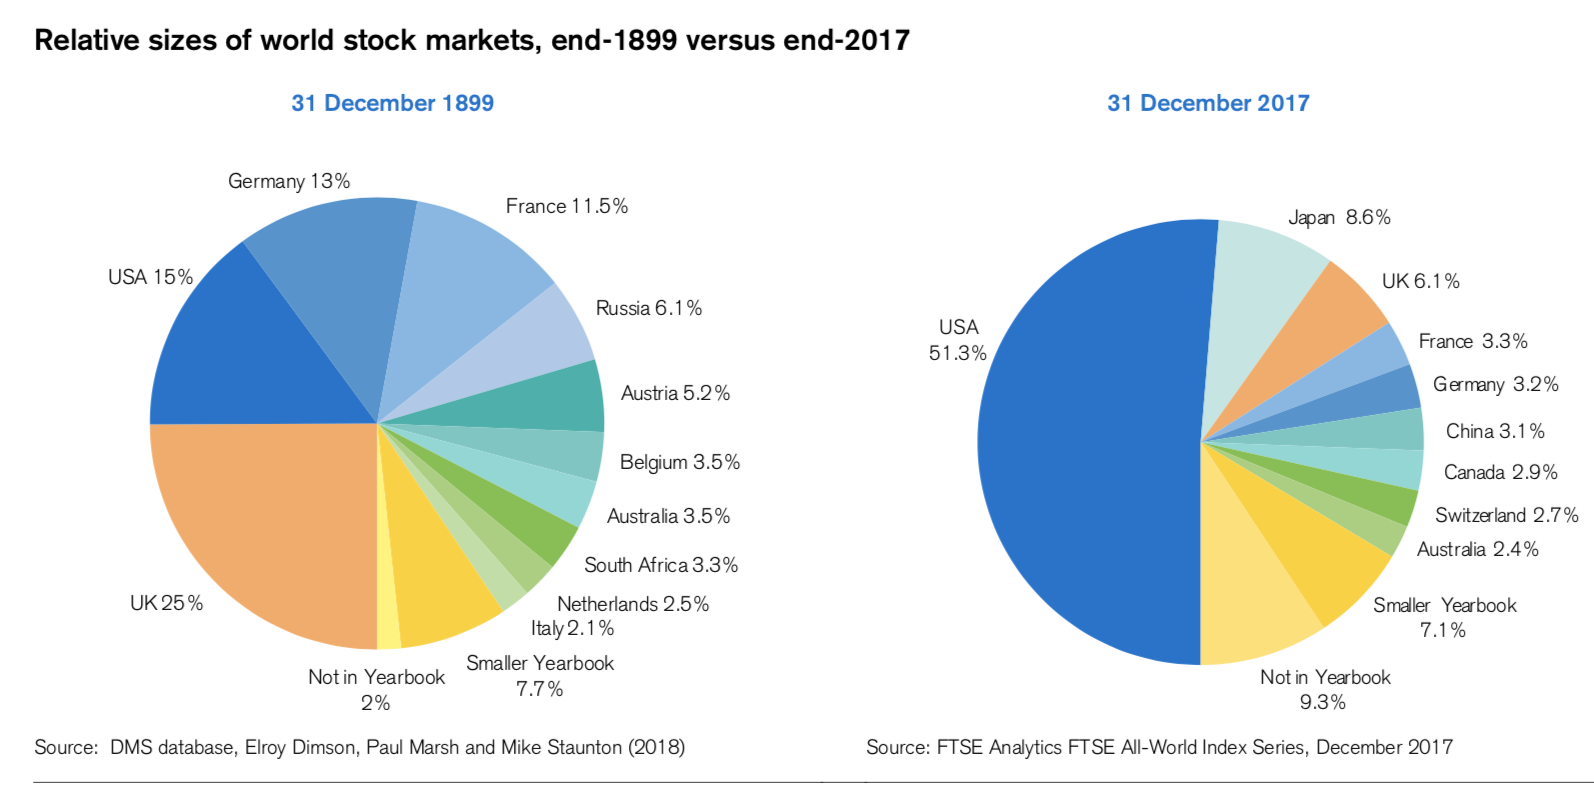
The first chart (Relative sizes of world stock markets, end-1899 versus end-2017, above) shows the relative sizes of world stock markets, from 1900-2017. As you can see, the US was a mere 15% of the global pie at the start of last century; today it is over half (by capitalization). This should cause you to wonder: Are those prior levels of high U.S. returns will be sustainable for the next century.
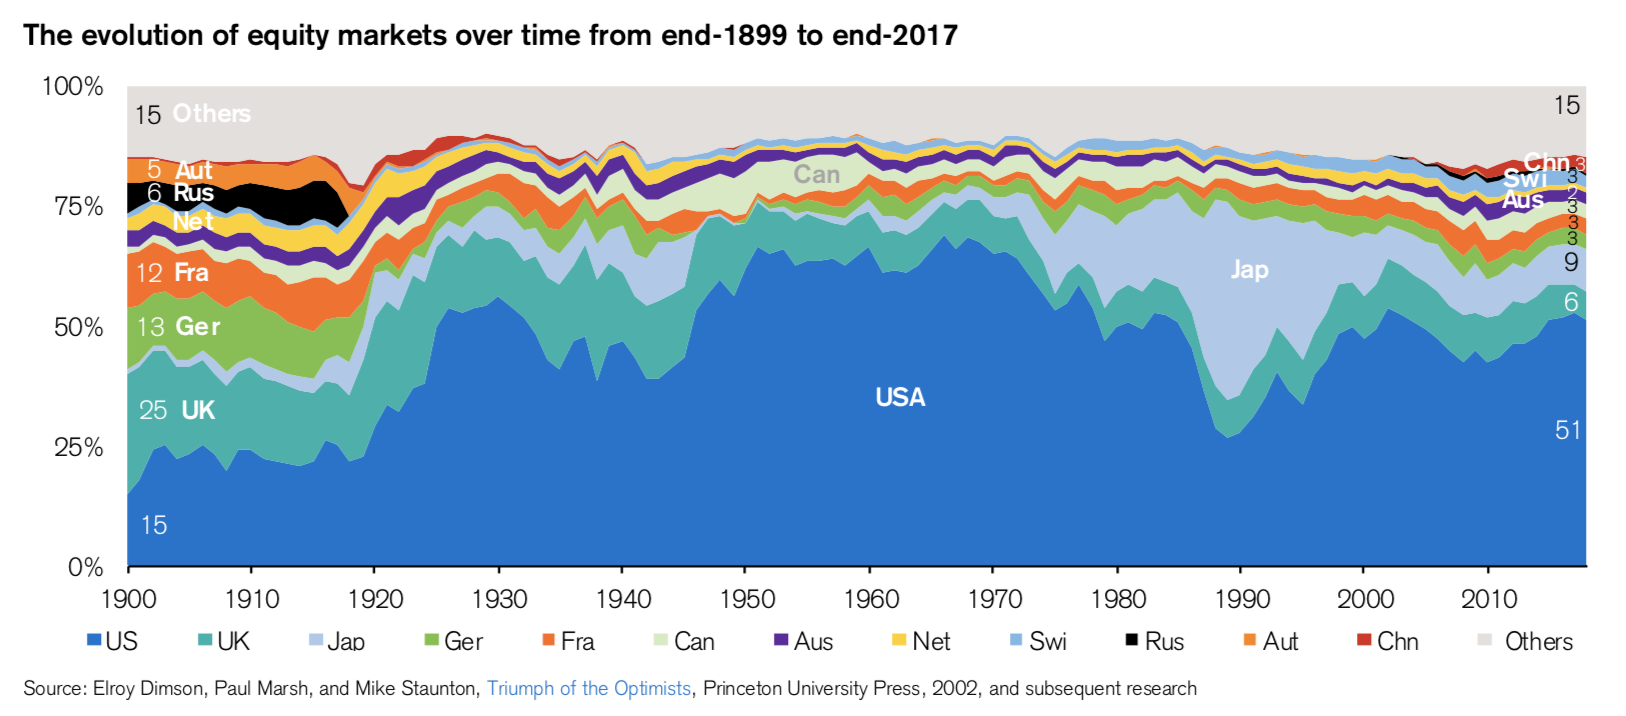
Second, look at the ebbs and flows in the chart below, (Evolution of equity markets over time from end-1899 to end-2017, below). The USA has seen its global share rise and fall several times. Also noteworthy: how Japan ballooned up during 1990s & 90s; at its peak, it became almost half of the global market cap.
The lesson for investors is three part:
-Be aware of your own home country bias;
-understand how this balance shifts over time;
-hold a globally diversified portfolio.
To make sure you are not over-exposed to the place where you live, review all of your own portfolios (investment, retirement, etc.) X-Ray them, look to see if your holdings significantly overweight US stocks (or where ever your bias lives), consider more exposure to Emerging Markets and Developed Ex-US.
You will likely reduce overall volatility, lower risk, and could actually improve your returns . . .
Via Credit Suisse
