
by R. Jason Faberman, Thomas Haasl, Andreas I. Mueller, Ayşegül Şahin, and Giorgio Topa
In a previous post, we examined the job search behavior of workers, both on the job and while unemployed. We found that job seeking is pervasive among employed workers, and that searching while employed is more effective than searching while unemployed in producing employer contacts and job offers. But how do the offers received through “on the job” searches compare to those received while unemployed? What do their wages look like, how do they compare in terms of nonwage benefits, and how much bargaining between employers and job applicants is involved? In this post, we shed some light on how job offers may vary depending on the employment status of the job seeker.
As in our previous post, we use novel data from a job search supplement to the New York Fed’s Survey of Consumer Expectations that has been fielded every October since 2013. To ensure a sufficiently large sample of offers, we pool data from four successive waves of the survey supplement, covering the period 2013-16. The supplement offers a detailed and extensive view of the job search process and provides information on the number, type, and characteristics of offers received, regardless of the job seeker’s employment status.
The findings discussed in what follows are based on a sample of 3,447 individuals aged 18-64 (excluding the self-employed), and on two associated samples of job offers received: the first one consists of 337 offers received by survey respondents over the prior four weeks, while the second takes a longer view and considers 862 offers received over the six-month period preceding the survey.
We also use two separate definitions of labor force status, corresponding to each sample of job offers: when we look at offers received in the last four weeks we consider labor force status (employed, unemployed, out of the labor force) four weeks prior to the survey interview; when we analyze offers received in the last six months we use information on labor force status at the time of the offer (employed vs. non-employed). The goal is to have as accurate a measure as possible of the job seeker’s labor force status when they actually received the job offer. More details on the data, the survey methodology, and our definitions are described here.
How Often Do People Receive Job Offers?
In the table below, we report some basic statistics about the rate at which job seekers receive job offers, and the rate at which they accept the best offer available to them. Roughly one in ten employed job seekers received at least one offer in the four weeks prior to the survey, compared to about one-third of unemployed job seekers.
As highlighted in our previous post, unemployed job seekers search much more intensively than the employed, so that even though they receive more offers in absolute terms they are actually less likely to receive a job offer per unit of search effort spent. The employed also exercise more screening even before a concrete offer is on the table: our survey asks respondents if they had indicated to any potential employer that they were not interested before the employer could make an offer.
Accounting for these “unrealized” offers increases the fraction of employed job seekers with at least one offer in the last four weeks to 14.5 percent—a roughly 40 percent increase in the offer rate, compared to a more modest 10 percent increase for the unemployed. Turning to the acceptance decision of job seekers, and focusing only on the self-reported “best” job offer received, the unemployed accept about half of their best offers, compared to 30 percent for the employed. This suggests that employed job seekers are more discriminating in their acceptance decisions than the unemployed: we will return to this later.

How Do Job Offers Differ?
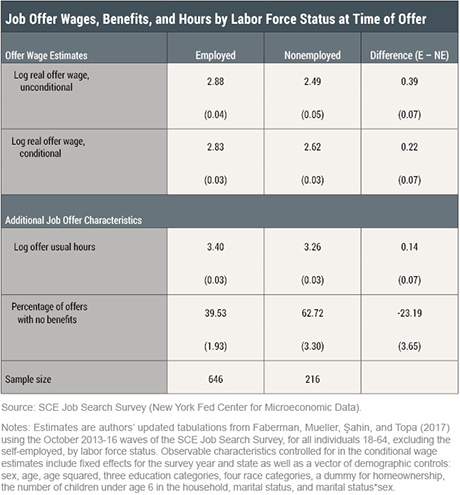
Next, we want to compare how job offers received by the nonemployed compare to those received by the employed. The following table describes the main features of the best job offer received by each survey respondent over the six-month period preceding the survey. The most striking result is that there are very large wage differences associated with these offers: on average, employed job seekers receive hourly wage offers that are 39 log points (48 percent) higher than those received by the nonemployed. Even after controlling for the observable characteristics of the job seeker and the employer offering the job, the employed receive wage offers that are still 22 log points (23 percent) higher, on average.
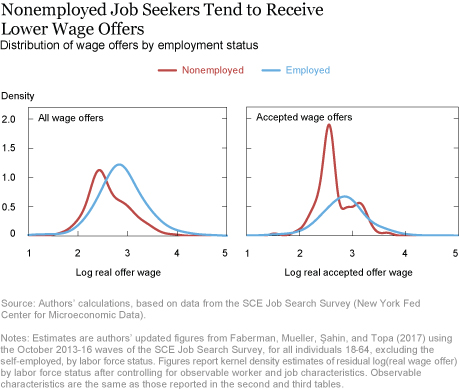
Of course, not all best offers received by the nonemployed are worse than those received by the employed. The figure below offers a visual depiction of the (smoothed) distributions of all wage offers (left panel) and accepted wage offers (right panel) by labor force status: while the distributions for the nonemployed lie clearly to the left of those for the employed (indicating worse offers on average), there is significant overlap between the two in each case.
The previous table also reports additional characteristics of the best job offer received by labor force status. The employed receive job offers with slightly higher weekly hours, on average, than the nonemployed. More importantly, there is a large difference with regard to the nonwage benefits of their offers (such as health insurance, retirement plans, commuter benefits, and so on). Roughly 63 percent of the offers received by the nonemployed come with no benefits of any kind, versus only 40 percent of the offers received by those searching on the job. Thus, the nonemployed receive both lower wage offers and fewer nonwage benefits.
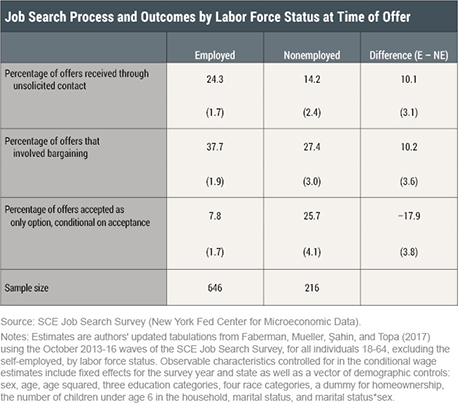
Finally, the next table highlights additional differences in the search process and outcomes between the employed and nonemployed. First, the employed are significantly more likely to receive their offer through an unsolicited contact by an employer, recruiter, or headhunter. That is, they are more likely to get an offer through no effort of their own. Second, offers received while employed are more likely to involve some form of bargaining between the job seeker and the prospective employer, suggesting a stronger bargaining position on the part of someone who already has a job and is considering a job switch, compared to someone who is currently not employed. Finally, the nonemployed are about three times as likely to accept an offer because it was their only option—consistent with the idea that the employed can afford to be more “choosy.”
Discussion
There are several possible explanations for the observed differences in the quality of job offers. One possibility is that workers’ skills depreciate during periods of nonemployment. This would lead to lower-quality job offers for the nonemployed because these individuals are now less employable.
Another possibility is that the employed have access to better professional networks. Better networks would lead to more frequent and higher-quality job offers, primarily through informal recruiting channels.
Yet another possibility is that there is some stigma associated with being unemployed—whether because of explicit discrimination by employers or because employers use current labor force status as a signal of unobserved worker quality. This would lead to a bias that awards better job offers to those who are already employed.
Finally, it is possible that employed workers simply have a stronger bargaining position. Those who receive a job offer while already employed are able to improve the quality of the offer through bargaining.
It is likely that all of these mechanisms play a role, but the specific magnitude of each channel remains to be explored. In any case, our findings highlight the importance of the employment status in determining job offer outcomes. The resulting divergence in outcomes amplifies differences in labor market experiences for different workers, thus representing a potential channel for earnings inequality.
Source: Liberty Street Economics
