
How a Bubble Steals From the Future
It can take years to recover from the frenzy.
Bloomberg, April 24, 2015
Yesterday, we discussed why the Standard & Poor’s 500 Index has gone sideways for the past few months. The prime suspects were rich valuations, earnings crimped by falling energy prices and higher returns to be had overseas.
Today, I want to look at the Nasdaq Composite Index. It closed at 5,056.06 yesterday, surpassing its March 2000 dot-com high. It took more than 15 years to breach that earlier mark. Meanwhile, the Dow Jones Industrial Average and S&P 500 passed their pre-crisis 2007 highs almost two years ago.
The Nasdaq has been the laggard, and there are many questions about why. Does this represent the triumph of value investing over growth? Dividends over potential? Blue chips over sexiness? Or is something else going on?
The answer, in my humble opinion, lies in the nature of secular market cycles. Although we only have a century or two of data, markets seem to alternate between multidecade booms and busts. Some analysts like to describe these as “secular.” These are different from cyclical markets, which are shorter. The period from 1966 to 1982 was a secular bear market, just as the stretch from 1982 to 2000 was asecular bull market. Compare that with the 74 percent rally that followed the plunged in 1973 — that was a cyclical bull market within a secular bear market.
These are more than arbitrary definitions. Secular markets typically reflect the dominant economic and sociological themes of their eras. Consider the post-War World II period, or the inflationary malaise of the 1970s or even the roaring 1980s and 1990s. Each of these periods can be defined by way of a generational, overriding idea. These were all significant secular market cycles.
I look at three key questions when trying to identify secular markets:
First, are markets stuck in a trading range, or are they breaking out to new highs? Second, where are valuations? (This cycle, heavily influenced by Federal Reserve policies, has forced us to add the phrase “relative to alternatives.”) And third, are price-earnings multiples expanding or contracting? How much investors are willing to pay for a dollar of earnings says a lot about the collective psychology.
Which brings us back to the issue of the Nasdaq. Why did it take 15 years for the tech-heavy index (though not as tech heavy as it once was) to make new highs?
The short answer is how stock-market bubbles pull gains into the present from the future. Toward the end of a secular cycle, the crowd becomes aroused and starts paying attention. Collectively, they begin to recognize how much money has been made during the past few years, and how much of the move they missed. So the crowd begins to pile in, somewhat late in the cycle and at somewhat elevated valuations. Inevitably, they do worse than those who were early to the show.
If humans were a rational species — and my experiences on this planet decidedly suggest otherwise — they would pay a reasonable price for risk investments such as equities. Markets discount future cash flow; a modest model suggests some sensible multiple of profits as a fair price to pay for a stock. Indeed, when we look at the history of investing, we see surprisingly regular mean reversion when it comes to prices paid relative to earnings. When stocks as a group are purchased at a very high multiple, the expected returns drop a lot; when they are purchased inexpensively, expected returns rise. A P/E ratio of 15 is about the historical average.
However, sometimes the blood lust grips everyone. If you have ever been out hunting with a pack of canines or attended a championship boxing match, you know what I speak of. The human forebrain can easily become disengaged, as the entire crowd of primates devolves into little more than a series of limbic-system responses to stimuli. It is highly infectious; most of you are incapable of avoiding that fever.
When your paleo-mammalian brain structures get over-stimulated, watch out! Adrenaline flows and emotions go wild. It is a fascinating albeit dangerous group behavior to observe. But it does create a fascinating study in evolutionary behavior. A very small handful of you have figured out how to take advantage of your fellow primates uncontrollable urges. Some of these folks are called “contrarians.”
Where was I? Ahh, that’s right, the bubble.
Recall the blood lust that took hold of most of our species in the mid- to late-1990s. Over time, the equity markets return about 8 percent to 10 percent a year. What should we expect as the most likely outcome when markets begin returning 40 percent to 100 percent a year? Those sorts of returns simply compress a decade or more of future gains into a brief period in the present.
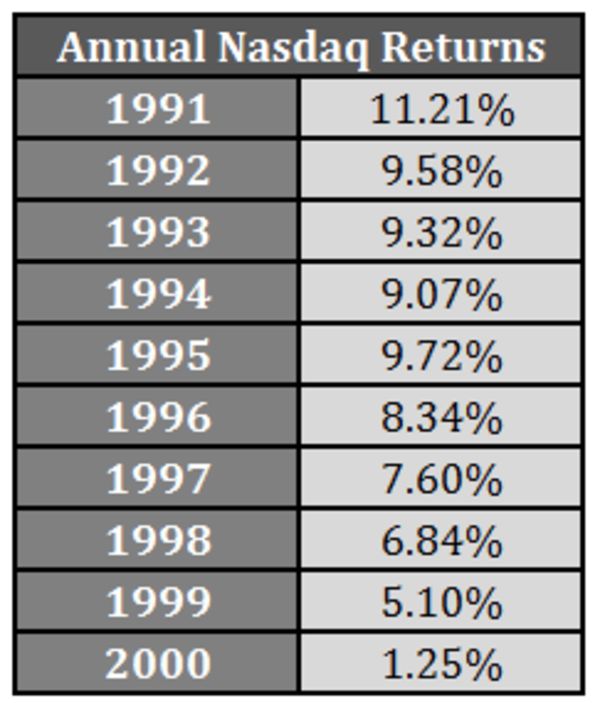
Think of this in the context of the wild overperformance of the Nasdaq in the 1990s: Each year of outsize returns then was responsible for several years of underperformance in the 2000s.
Ben Carlson, blogging at A Wealth of Common Sense, has demonstrated this by showing how much excessive gains today can hurt future returns. The chart below shows the decline in annual returns for investors who bought closer to the bull-market peak (all returns are through 2014):
The key questions now are: Have we finally worked off all of the excesses of that period and is the Nasdaq joining the Dow and S&P 500 in a new secular bull market? We might only know the answers in retrospect.
Originally: How a Bubble Steals From the Future

Just sayin . . .
http://research.stlouisfed.org/fred2/graph/?g=195v
BR, any thoughts as to why indices representing quite different segments of the market — and behaving quite differently, wrt valuation — seem to inflect (in varying degrees, due to the different amounts their respective valuations have been pumped up) at the same times? Is it nothing more than market hysteria infecting all the segments of the market, regardless of valuation?
If one throws up a chart comparing the S&P500, NASDAQ and Russell 2000 (really quite different currents of stocks in the river of “the market”) over the past couple of decades, we see that the R2000 really did not participate in the runup of the 1990s, and was punished much less than the other two, then all three proceeded to perform similarly up until the mess in 2008, following different paths from the recovery in 2009, a distinctly different behavior from the 2003 recovery. One could almost devise a scheme wherein the differential changes in these indices relative to each other could not only identify the bursting of bubbles (something that really needs no help), but also point to a (relatively) safe haven for the money from overvalued stocks to reside in until the same index differentials signal a recovery is under way AND which index is leading the way to the next top (indicating what kinds of stocks to emphasize in one’s portfolio).
I’ve only looked back a couple of decades, so this may not hold up if we look at a larger number of boom-bust cycles, but it strikes me as a novel approach (novel to me, anyhow).