
The market professionals are returning from their long holiday vacations. That may explain why futures were looking so strong Tuesday morning and the market surged at the open, or it may beShanghai’s late rally that accounts for the brighter outlook. As we have seen, futes can tell us how the markets may open, but not how they are going to close. Regardless, this upswing is noteworthy.
Last month, I said my “greatest concern was the long-term trend break.” Perhaps it’s time to revisit the discussion of “How Badly Was the Stock Market Damaged?“ As I said last time, that trend break caused significant technical damage. That alone isn’t fatal to a bull market, but it does mean that some heavy lifting will be needed to re-establish the uptrend.
Given all of the green on the screen, this could be a good time to think about what big up days usually mean. I am not a big fan.
Why? For several reasons. Typically, they occur when the market has already run into trouble, and are often technical in nature. An analysis by Michael Batnick at The Irrelevant Investor, showed that 22 of the 25 best days since 1970 occurred under the 200-day moving average. That implies they were oversold rallies with some element of short covering. Traders may like them, but long-term investors would much rather see three 100-point days than one 300-point day. The more gradual gains reflect a healthier accumulation and not a reflexive reaction.
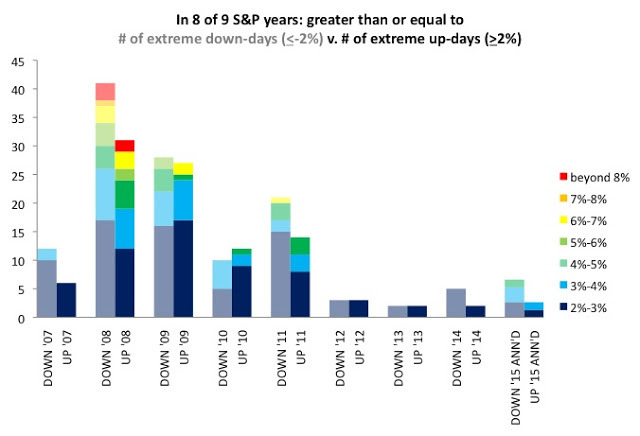
Salil Mehta at Statistical Ideas offers further research into the phenomenon. He looked at the number of trading days with greater than 2 percent moves up or down over the past nine years. That period included the 2008-09 bear market, as well as the subsequent recovery rally to new highs. According to Mehta, “extreme up-days (e.g., >2 percent) are generally far more rare than equal magnitude swings to the downside.” The +2 percent sessions accounted for only 4 percent of all trading days since 2006; trading days that were down more than 2 percent over the same period accounted for almost 6 percent of the total.
In other words, almost 1 of 10 trading days over the past 9 years featured an outsize move up or down. Of those outsize trading days, 100 were up and 129 were down. Or to put it another way, more than 4 percent of all trading days in that period were positive and almost 6 percent were negative.
To give these extreme days a little color, look at the chart below. It is interesting to note that many of these occurred in 2008 and 2009, and only one of the past 9 years — 2010 — had extreme up days that outpaced extreme down days.
Mehta also notes that despite the substantial moves off the lows, and the “many years of near zero interest rates and central bank asset purchases, we’ve only had 7 extreme up-days in the 3 years covering 2012, 2013, and 2014 (less than 1 percent of the days!).” Those days of easy money and easier gains are likely behind us.
Of course, the caveat is that anything can and will happen, and as data come in that change the dynamics, you must be ready to change with them. I reconsidered the Sell the Bounce approach, having dropped my small cap and emerging-market holdings in 2011, only tosubsequently reverse myself after the Federal Reserve introduced a new round of quantitative easing.
Being dogmatic is never a good approach in markets. There are no absolutes. Nonetheless, I stick by my original point: Big up days should be treated warily; trust must be earned, not very easily given.
originally published as Don’t Trust the Market’s Big Up Days
