
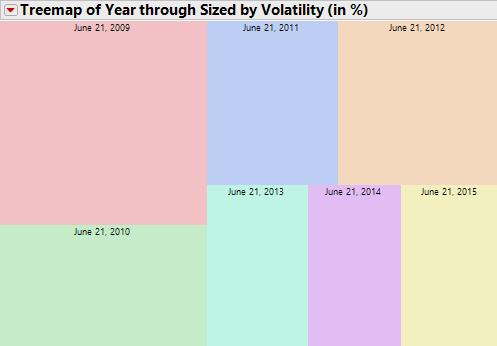
This is a statistics chart of all of the volatility for the year… In yellow on the lower right we see it for the past 52-weeks (through June 21, 2015). We can visually see of the past 7 years, the last 3 have been equally and quite subdued. Only 29% of all volatility in the past 7 years, while 3/7=43%.
- 2009 –> 26%
- 2010 –> 16%
- 2011 –> 13%
- 2012 –> 16%
- 2013 –> 10%
- 2014 –> 9%
- 2015 –> 10%
Source: Salil Mehta
