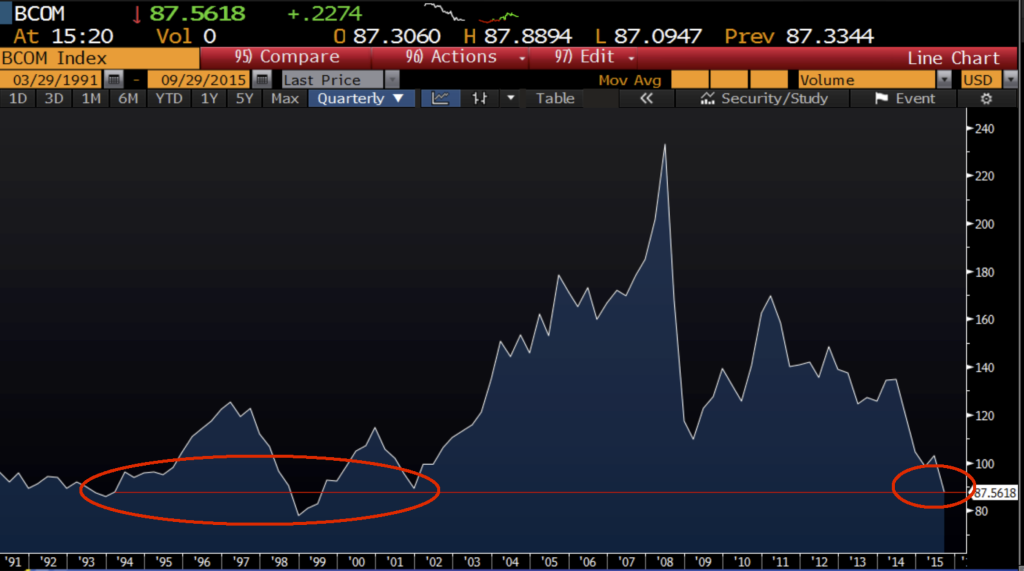
 The chart above is the Bloomberg Commodity Index. It consists of baskets of common commodities, including energy, metals, foodstuffs, softs and precious metals.
After a fairly flat period in the 1990s, the index leapt upward beginning in the early 2000s. The context explains the jump: High inflation, weak dollar and low interest rates. From 2001 to 2007, the dollar lost 41 percent of its value, and all commodities priced in dollars skyrocketed. At the same time, China began a huge expansion of its infrastructure, transportation, housing and manufacturing sectors. The BCOM index moved from around 90 to almost 240.
You know the rest of the story: Inflation is nowhere to be found, and the Federal Open Market Committee is concerned about deflation. The dollar is at multiyear highs against just about any other currency. Commodity prices have suffered as a result.
Continues here: Why Commodities Are Back in the 1990s


Different commodity indexes send different messages, according to their weightings. Energy is 31.19% of the Bloomberg commodity index, while it is only 18% of the Thomson Reuters Equal Weight Continuous Commodity Index.
Heavy energy weightings accurately reflect global trade volumes. But for individuals and commodity funds, equal weighting is probably more pertinent.
Currently the CCI index is still at about twice the level of its 1998 and 2001 lows. In inflation-adjusted terms, those lows plumbed the same dark depths as 1933.
If the CCI does revisit those lows … I’ll be worried.
Sure inflation is to be found. Strip out commodities. People make this mistake all the time. Inflation is higher now than 2 years ago.