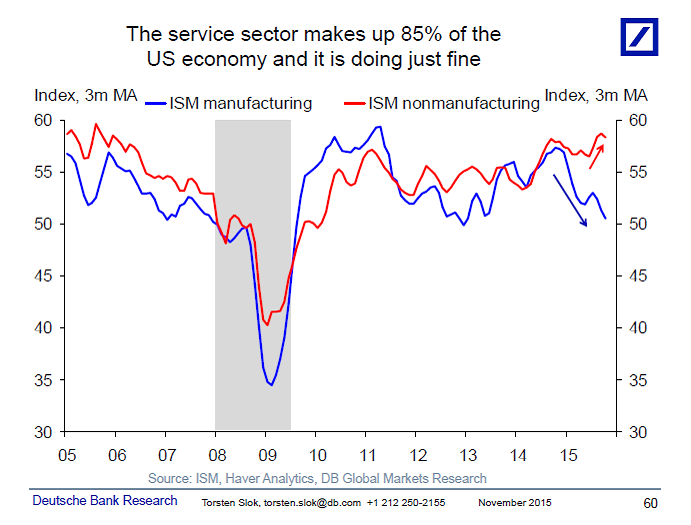
Nice chart:
Torsten Sløk:
The data this week for manufacturing ISM and nonmanufacturing ISM continues to show that the service sector in the US economy is in good shape, see chart below. And with the service sector making up 85% of total US employment, the broader economy should still be fine. Combined with ADP for October at 182k we continue to see little spillover of the problems in the manufacturing and energy sectors to the rest of the economy. Put differently, if nonfarm payrolls on Friday come in around 180k then it will be a strong sign that the modest slowdown in employment growth in August and September was temporary, and likely driven by the China-associated turbulence seen in markets in August. With S&P500 and VIX back at pre-August levels we should continue to see solid economic data going into the December FOMC meeting. For more discussion see also my monthly chart book I sent out yesterday.


Yes a strong dollar hurt manufacturing a lot more than the service sector. So just the anticipation of a rate hike is hurting the economy.
Boy the banksters must have a huge bet in favor of rate increases. There seem to be no straw or strawman to little for them to grasp at. That red up arrow is pathetic. The up and down bumps from 2011-2014 are bigger than that little “upturn” in 2015. If they had drawn both arrows from the same starting point the red would have been flat. So nothing “solid” in that data. But if you have a narrative to sell, then you do what you got to do, failing to realize how silly you look.
so does that tell us that the ‘service’ economy is actually bad for the US? as in incomes are much lower than what a manufacturing economy has? and what does that say about the future if any thing
No. The chief reason incomes are low, in my opinion, is that rank and file workers have little representation in the federal and state governments. The main lobbying force for workers has always been unions, but a multi-decade propaganda campaign against unions has been very successful and many people that would benefit from unions, and are benefiting from unions, absolutely hate them.
Unions do a lot more than negotiate employment contracts. They also lobby for better labor laws, fairer tax policy and good corporate governance.
Per capita income is doing just fine, the problem is unfair income distribution:
https://research.stlouisfed.org/fred2/graph/?g=2yld
Note the general rise in real per capita income, but the general fall in real median household income. That’s a problem.
In some ways the rank and file have brought this on themselves by attacking each other instead of looking out for one another’s interests. Just look at how the teachers unions are routinely attacked and government workers are attacked. People eat this stuff up. It’s divide and conquer.
KDawg – Well put, and well said……
Is part of the reason for convergence of per capita and household income due to a growing number of one-person households?
https://www.census.gov/hhes/families/files/graphics/HH-4.pdf
Here is the graph.
Clearly not based on that particular census graph. Using the same time period:
https://research.stlouisfed.org/fred2/graph/?g=2zeH
We see real median household income was still rising even with the rise in households with one person. 1984-2000. The start is the earliest the data is available on FRED.
The graph to dig up would be the number of working age members of the median household, not how many one person households exist. FRED and Google did not pop that data for me.
The problem is that this is simply incorrect. GDP is not a measure of actual economic output. If you want to know which sectors actually produce the largest output, you have to consult gross output data. GDP omits all intermediate stages of the production structure. In reality, manufacturing is the by far largest sector of the economy by output, comprising 45% (consumption by contrast is only about 35%).
I am confused. Does this mean if I make bicycle wheels and someone else buys the wheels for $100, installs them on a bicycle frame they built and sells the bicycle for $200, we count this as $300 GDP? But if we each sell our wheels and frames separately for $100 each, GDP is $200?
Service vs. manufacturing is the classic guns vs. butter trade-off. An increase/decrease in manufacturing changes employment much more dramatically than the same dollar amount change of service. So while it is true that a rising dollar and plummeting commodities eventually create lower prices for consumers, those consumer savings side don’t nearly “compensate” the economy for the lost jobs on the manufacturing side. This is exactly what we are seeing over the last 6 months: marked increased consumer real income without a corresponding increase in consumer spending.
So 85% of the US economy is taking in each other’s wash.
Is retail sector part of the “service” economy? Do Wal-Mart, Macys, Nordstrom earnings decreases mean something? Anything??? How about Sears and JCP? Maybe Coach and Michael Kors? Maybe DSW?
My question is simple: should I believe the BLS that, through the use of birth/death adjustments and other statistics, cheerfully claims that retail has been hiring like it’s 1999 again, or should I believe my own eyes and the market prices that unequivocally say that even if these thousands of people were actually hired, they (and then some) will be imminently laid off in a matter of weeks?
And if the rumored 10% cuts for Apple suppliers turn out to be correct and mortgage/refi slows down and hurts Home Depo – it’s game over