
What history tells us about your investments in 2017
Barry Ritholtz
The Washington Post, January 1, 2017
“Life can only be understood backwards; but it must be lived forwards.”
— Soren Kierkegaard
We do not have a crystal ball, but we can think about what might happen in 2017. The secret is to avoid playing the guessing games that are common this time of year. Instead, we can consider various crosscurrents that might affect the economy, the markets and our portfolios. We can discern important factors at work here and now, and then use historical data to provide context for it all.
No forecasts are necessary.
My first column here (way back in 2011) was “Why politics and investing don’t mix.”
One of my favorite examples of White House impact (or lack thereof) is President Grover Cleveland. His first term (1885-1889) saw stocks increase by 53 percent; in his second term (1893-1897) they fell 2 percent. Did he forget how to make stocks go up? Or more likely, was it the business cycle and the economy all along?
As for partisan politics, when we look at stock returns by party since 1854, we see the gains are very close: When Democrats have the presidency, returns were 1,342 percent; under Republicans, it was 1,269 percent.
Regardless, all presidents get too much credit when things go well and too much blame when they don’t. The political risk factor to investors is not partisan politics or specific policies. The biggest risks can be watershed events: think Vietnam or Watergate or President Bill Clinton’s impeachment or the Iraq War. None of these boded well for investor sentiment or subsequent returns.
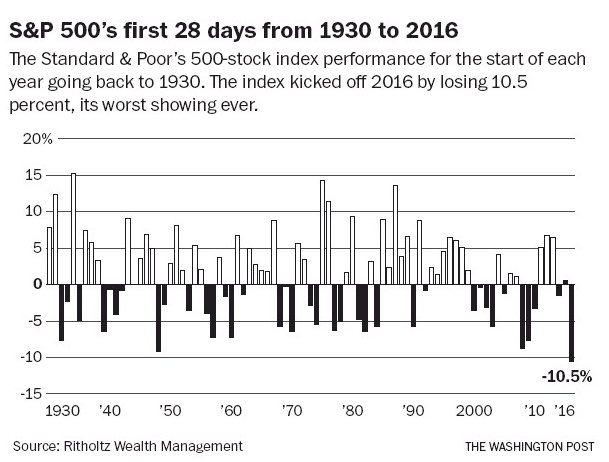
“As goes January, so goes the year.” That was the refrain when 2016 began with the worst start ever. The Standard & Poor’s 500-stock index fell 10.5 percent over the first 28 days. The narrative at the time was all over the place: Stocks fell because of the imminent China collapse, or an earnings recession, or election uncertainty, or (my personal favorite) “this bull market is long in the tooth.” These are all examples of the “narrative fallacy” — the attempt to make sense of something after it occurred, ignoring the facts that don’t fit a convenient story line.
There were plenty of calls to SELL EVERYTHING in January and February.
That is rarely good advice; it was especially bad advice in the first quarter of 2016. Had you sold in January, you would have missed a 45 percent rise in small-cap stocks, a 36 percent gain in Japan, 25 percent gain in U.S. large-cap stocks, 31 percent gain in emerging markets, and a whopping 57 percent gain in energy-related stocks. Missing rallies of this nature can be devastating to the long-term performance of any portfolio.
Let’s start with CAPE — the cyclically adjusted price-to-earnings ratio. Think of it as the 10-year P/E ratio. It is high for U.S. equities by historical averages, elevated for Japan, moderate for Europe and low for emerging markets. Those are simple facts.
If I wanted to scare people, I could selectively pull data showing that at present we have the highest reading outside of 2000 (43.2), 1929 (32.5) and 2007 (27.6). But cherry-picking dates to scare people is bad form, and I prefer to use the data to look for evidence.
What does it show? Since 1990, the S&P 500 has traded above the average CAPE ratio in 307 of 324 months — that’s 95 percent of the time. If you abandoned U.S. equities when the CAPE ratio was overvalued, you would have missed gains of more than a 1,000 percent over that time. In fact, had you only invested when the CAPE was 25 percent overvalued — i.e., when stocks were simply “expensive” — your total returns since 1990 would have been 650 percent. This is one of many reasons it is ill-advised to use valuation as a timing mechanism.
The most I can say about higher-than-average valuations is that when the CAPE ratio is significantly above its long-term average, you should lower your expectations for future returns. In other words, if the 100-year average S&P 500 return with dividends reinvested is about 10 percent, you should expect average equity returns over the next five to 10 years to be somewhat lower. That doesn’t mean we won’t see good or bad returns in any given year; when the CAPE has been over 25 in the past, over the next five years returns ranged from 18.7 percent to negative 17.4 percent a year. The same returns when CAPE was in the five to 10 range were 10.3 percent to 36.1 percent. Hence why I suggest you should ratchet down your expectations.
Given how much the United States has outperformed other countries since the Great Recession ended in 2009, this is not a surprise. The good news is if you have been following what I write in this column, you should be well diversified in your portfolio. Your U.S. stocks have done well over the past seven years. And your exposure to global equities — when the equity leadership shifts, whenever that might be — is likely to benefit your portfolio even more. Because we never know what part of the world is about to see a stock market rally, we diversify by owning the entire globe.
Fixed-income investors have enjoyed a bull market that has lasted over three decades. What will happen if that comes to an end? The Federal Reserve just raised rates, and it has signaled that it could raise rates three more times next year.
We have seen bond bear markets before. Consider the postwar period (1941-1982), when yields on the 10-year went from 2 percent in 1941 to 15 percent in 1981. You may be surprised to learn that the worst year during that 41-year bear market was a mere 5.01 percent loss in 1969; the second-worst year was 1980, and that was less than a 3 percent loss. Nominal losses — i.e., pre-inflation — are not what hurts fixed-income investors; inflation is what is so devastating to bondholders.
During the 10 worst years during that bear market, the average loss was 2.1 percent. However, inflation averaged 4.49 percent. In real terms, inflation did more than twice as much damage to bond portfolios than losses did.
Secular bull market
Many people anchor their frame of reference to the financial crisis in March 2009 when markets crashed to their lows. It was an enormously emotional event that left a painful mark on people’s psyches. Hence, they assume the current bull market is nearly eight years old.
But bull markets are not measured from prior lows; rather, it is from where they break out of the prior bear-market trading range and start making new highs.During the 1970s bear market (1966-1982), the Dow Jones industrial average repeatedly kissed 1,000 but did not get over it until 1982. The lows were made in 1974, but the next bull market is dated from that breakout above 1,000 in 1982 (Hence, the 18-year bull run to 2000). Similarly, if history determines that this is a new secular bull market, it won’t be dated from the March 2009 lows, but rather from the breakout to new highs in April 2013. If that turns out to be the case, this market could have a very long way left to run.
~~~
Ritholtz is chief investment officer of Ritholtz Wealth Management. He is the author of “Bailout Nation” and runs a finance blog, The Big Picture. On Twitter: @Ritholtz.

What's been said:
Discussions found on the web: