
In today’s column (posted here shortly), we look at steady versus volatile performance. A few charts and tables didn’t make it into the column, but I wanted to share them with readers.
The first is this table of two hypothetical funds. Each average 8 percent a year for 14 years. As it turns out, steady 8 percent per year beats big wins and losses far above and below the average. The difference between the two sets of returns are potentially substantial. Note I made up the numbers, and distributed wins and losses randomly.
click for bigger table
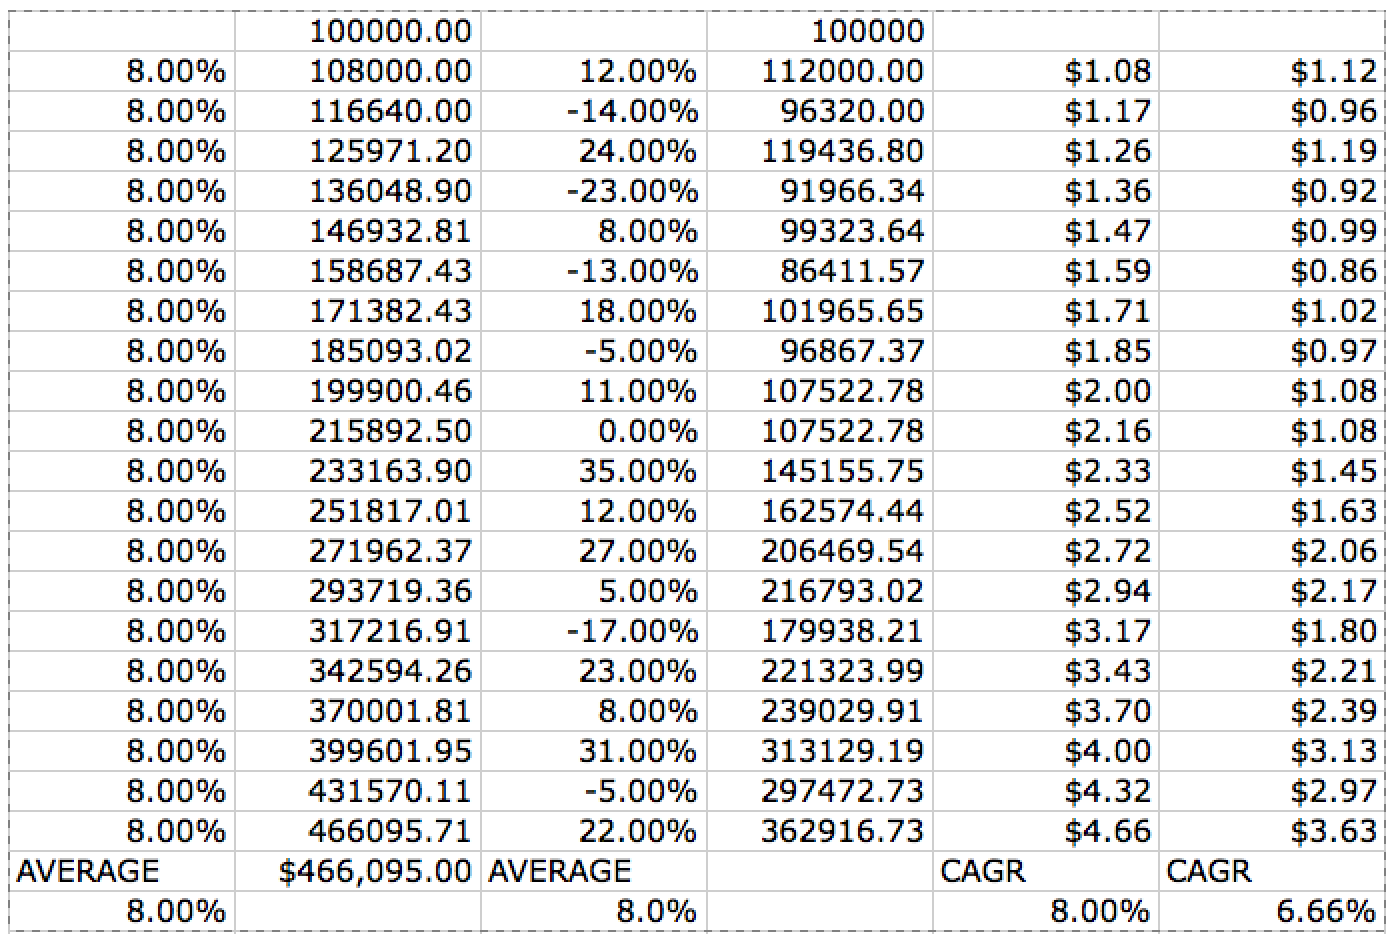
Source: My imagination
I posted the spreadsheet here; You can play with the numbers yourself).
As a comparison, consider this outlier: Bill Ackmann’s Pershing Square Capital. As of the end of 2016, and even with last year’s drubbing in Valeant Pharamaceuticals, his numbers are still astounding:
click for bigger chart
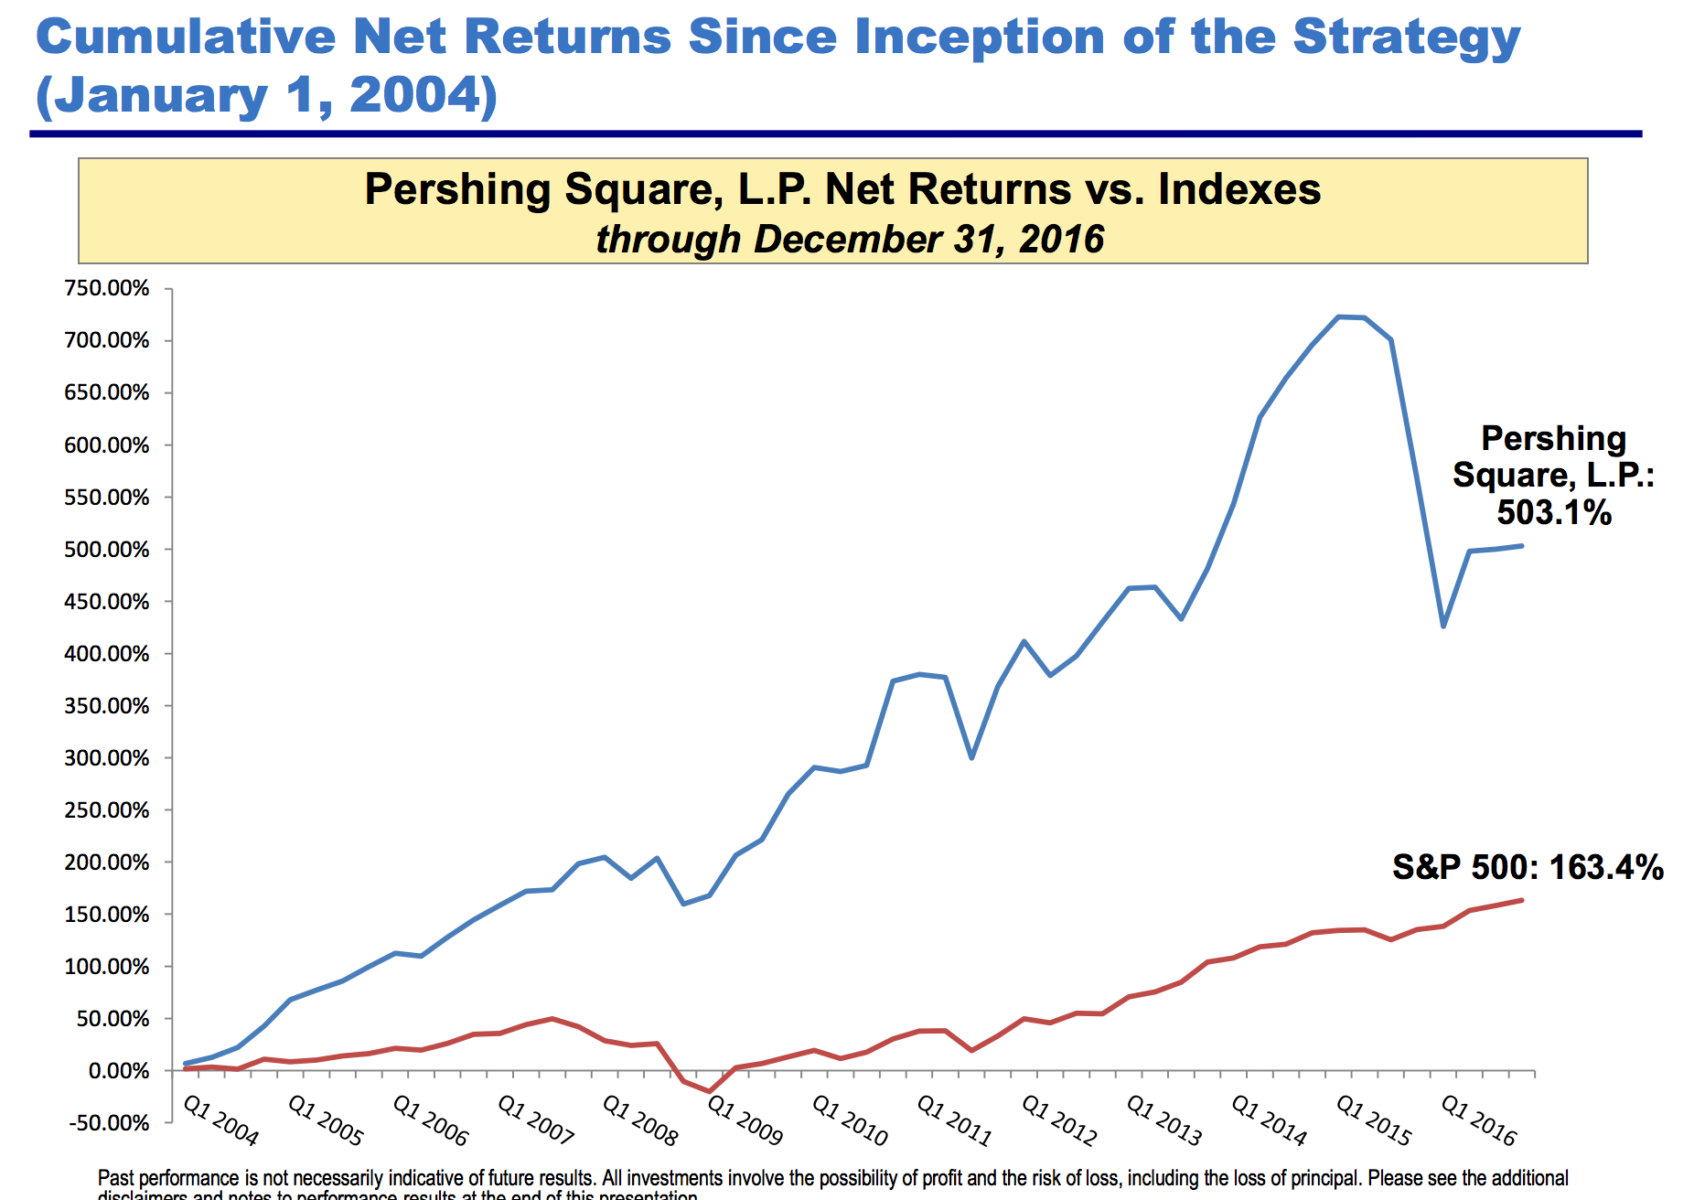
Source: Pershing Square Capital
The secret as we discuss today is to have some big up years early in your career — you can attract a lot of capital, and that will generate huge fees over time.
click for bigger table
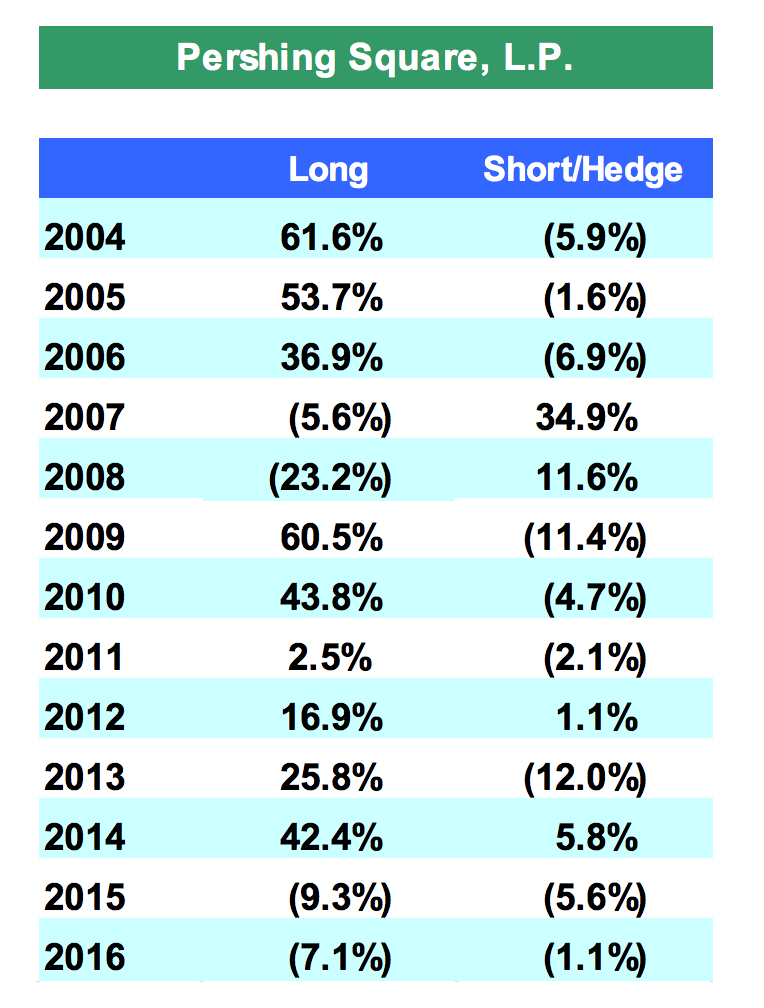
Source: Pershing Square Capital

What's been said:
Discussions found on the web: