
How Have the Fed’s Three Rate Hikes Passed Through to Selected Short-term Interest Rates?
Alyssa Anderson, Jane Ihrig, Mary-Frances Styczynski, and Gretchen C. Weinbach*
Board of Governors of Federal Reserve System, June 02, 2017
Since December 2015, the Federal Open Market Committee (FOMC) has increased the target range for the federal funds rate by 25 basis points three times, bringing the target range from 0 to 25 basis points in late 2015 to 75 to 100 basis points in March 2017. This Note examines how this cumulative 75 basis point increase in the target range for the Fed’s policy rate has transmitted to other short-term interest rates.1 We look at overnight unsecured and secured funding rates and several term rates, considering those that are available to institutional market participants as well as retail investors.
What’s happened in overnight money markets since the Fed began hiking rates?
Overnight money market rates have moved up smoothly with each of the FOMC’s increases in the target range for the federal funds rate. In particular, both unsecured and secured overnight interest rates have risen in line with each change in the target range with little volatility. “Unsecured” transactions in money markets are those in which the borrower does not offer collateral to the lender as part of the transaction; such trading occurs in the federal funds and Eurodollar markets, among others.2 “Secured” transactions in money markets are collateralized, such as in the market for repurchase agreements or “repos.” Figure 1 shows that each of these overnight interest rates moved up in lockstep with each increase in the FOMC’s target range for the federal funds rate (the shaded area).3, 4
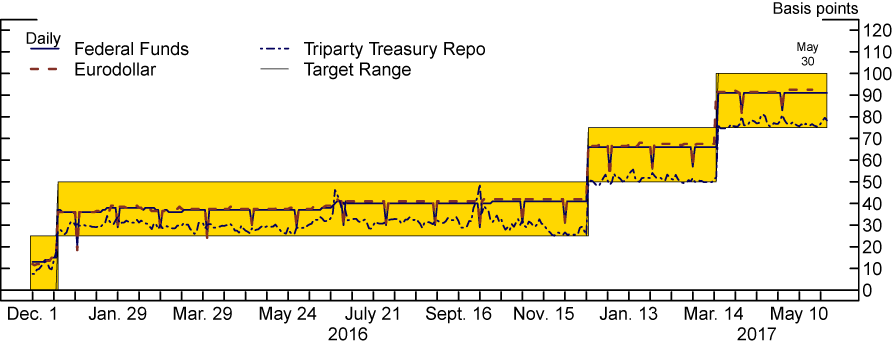
Source: For Federal Funds, Federal Reserve, Report of Selected Money Market Rates (FR 2420), https://www.newyorkfed.org/banking/reportingforms/FR_2420.html; for Triparty Treasury Repo, Federal Reserve Bank of New York; for Eurodollar, Bloomberg.
Next, we consider the transaction-level data that underlie the aggregate data to take a deeper dive into activity in these money markets.5 Figure 2 highlights that the Fed’s rate increases have had little effect on the dispersion of individual rates at which federal funds have traded, suggesting there has been little change in the relative behavior of individual market participants around the time of each rate hike. The solid red line shows a cumulative distribution function of federal funds trades that occurred during the two weeks after the first rate increase (between December 17, 2015, and December 30, 2015). The dashed vertical line to the left of this distribution indicates the Fed’s ON RRP offering rate at that time (25 basis points) and the dashed vertical line immediately to the right of this distribution indicates the interest rate paid on reserves at that time (50 basis points); together these two vertical lines indicate the width of the FOMC’s prevailing target range for the federal funds rate of 25 to 50 basis points. As illustrated, the bulk of federal funds trading occurred in a narrow range of about 32 to 37 basis points, roughly in the middle of the FOMC’s new target range.
The dashed blue and dot-dashed green lines show the same representation of trades after the second (between December 15, 2016, and December 29, 2016) and third (between March 16, 2017, and March 30, 2017) rate increases, respectively. With each rate increase, the distribution of federal funds trades shifted to the right in a parallel way, with the bulk of trading occurring each time roughly in the middle of the FOMC’s new target range. After the third rate hike, the dot-dashed yellow curve, with the target range for the federal funds rate at 75 to 100 basis points, most federal funds trading took place at rates of about 90 to 92 basis points. Overall, using the average effective federal funds rate in the two weeks prior to the December 2015 rate hike as a base and the median point of each curve below as markers for change, the cumulative change in the market federal funds rate over the period shown has been 78 basis points.
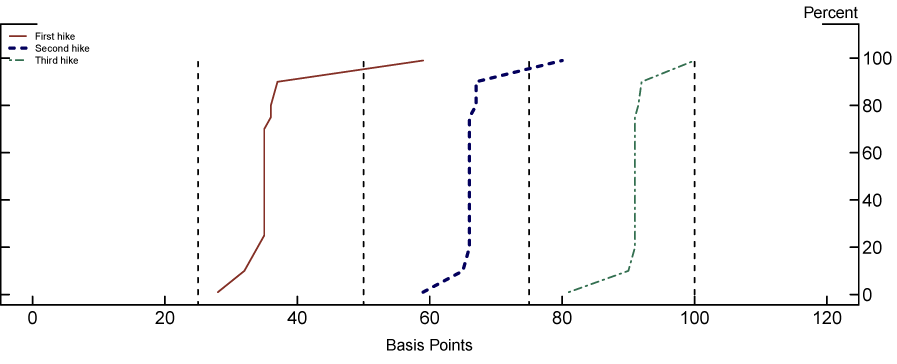
Note: These CDFs are stylized in that we show selected percentiles (the 1st, 10th, 20th, 25th, 30th, 40th, 50th, 60th, 70th, 75th, 80th, 90th, and 99th percentiles) rather than entire, smooth distributions. “First hike” includes trades over the two-week period from December 17−30, 2015; “second hike” includes trades from December 15−29, 2016; “third hike” includes trades from March 16−30, 2017. Each neighboring pair of dashed vertical lines represents the width of the target range for the federal funds rate that prevailed with each rate hike, with the left line of each pair indicating the Federal Reserve’s ON RRP offering rate and the right line of each pair the interest rate paid on reserves.
Source: Federal Reserve, Report of Selected Money Market Rates (FR 2420), https://www.newyorkfed.org/banking/reportingforms/FR_2420.html.
We see a similar pattern in the movement of rates in the overnight triparty Treasury repo market after each rate hike. Similar to Figure 2, Figure 3 shows a cumulative distribution function of triparty trades that occurred in the two weeks just after each of the Fed’s three rate increases. With each increase, the distribution shifted to the right largely in parallel, and the bulk of trading occurred at or slightly above the bottom of each new target range. This pattern of trading reflects the fact that the ON RRP facility is a viable alternative repo investment option for many financial institutions, and therefore the facility forms a fairly firm floor on overnight market repo rates. As above, using the average overnight triparty Treasury repo rate that prevailed in the two weeks prior to the December 2015 rate hike as a base, and the median point of each curve below as markers for change, the cumulative change in the overnight triparty Treasury repo rate has been 66 basis points.
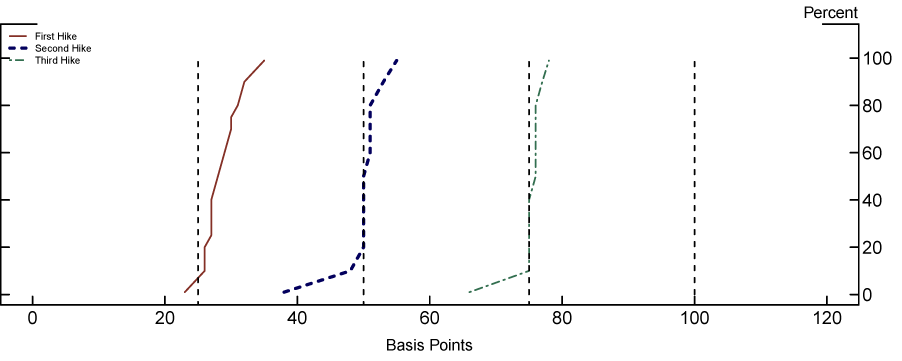
Note: These CDFs are stylized in that we show selected percentiles (the 1st, 10th, 20th, 25th, 30th, 40th, 50th, 60th, 70th, 75th, 80th, 90th, and 99th percentiles) rather than entire, smooth distributions. “First hike” includes trades over the two-week period from December 17−30, 2015; “second hike” includes trades from December 15−29, 2016; and “third hike” includes trades from March 16−30, 2017. Each neighboring pair of dashed vertical lines represents the width of the target range for the federal funds rate that prevailed with each rate hike, with the left line of each pair indicating the Federal Reserve’s ON RRP offering rate and the right line of each pair the interest rate paid on reserves.
Source: Federal Reserve Bank of New York.
What’s happened in term money markets since the Fed began hiking rates?
In general, term money market interest rates reflect not only current overnight interest rates but also market participants’ expectations for the future level of overnight and other shorter-term interest rates. As such, term money market interest rates tend to rise ahead of the FOMC’s hikes in the target range for the federal funds rate when such increases are seen as being at least somewhat likely to occur.
In particular, in recent quarters, interest rates in term money markets, including yields on three-month Treasury bills and commercial paper, increased a bit ahead of the time of each of the Fed’s three rate hikes. As shown in Figure 4, these interest rates generally moved up in the weeks prior to each policy tightening because market participants came to view an increase in the target range for the federal funds as being quite likely.
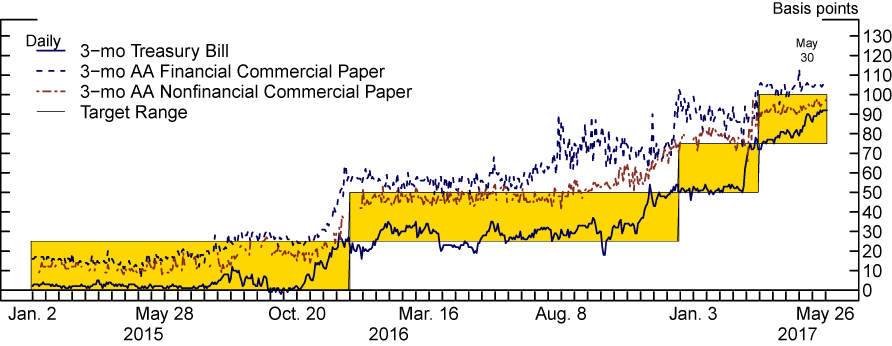
Note: All rates are reported on a discount basis. Commercial paper rates are not available on days when no commercial paper is issued.
Source: For Treasury Bill, U.S. Department of the Treasury; for AA Financial and Nonfinancial Commercial Paper, Federal Reserve Board.
The yield on three-month Treasury bills has continued to be below other money market interest rates of comparable maturity and near the lower end of the target range for the federal funds rate over this period. In particular, this yield has often been below the federal funds rate, especially in the post-crisis period. Counterparty credit risk is viewed as essentially zero for Treasury bills and demand for safe, liquid assets may generally be higher now in the wake of the financial crisis, so one might expect bill yields to be lower than the federal funds rate. Of course, the term premium associated with a three-month bill yield tends to work in the opposite direction, boosting the term yield relative to the federal funds rate. Overall, the relationship between Treasury bill yields and other money market interest rates has remained fairly stable since the Fed’s first rate hike. Compared with the average rate that prevailed three months prior to the Fed’s December 2015 rate hike, the 3-month Treasury bill rate is about 74 basis points higher, on balance.
Three-month commercial paper, on the other hand, was trading near the federal funds rate in 2015 but moved higher in 2016, largely as a result of the U.S. Securities and Exchange Commission’s money market fund (MMF) reforms. In the year leading up to the October 2016 deadline for implementing the reforms, around a trillion dollars shifted from prime MMFs to government MMFs. Given that prime funds invest in commercial paper (especially financial commercial paper), the significant reduction in demand for commercial paper that resulted from the substantial shift in MMF assets drove commercial paper rates up, especially in the summer of 2016. However, as the decline in MMFs’ holdings of commercial paper has been partially offset by other investors coming into the market, as well as by issuers of commercial paper increasing their reliance on other types of funding, commercial paper rates have somewhat retraced those increases. Compared with the average rates that prevailed three months prior to the Fed’s December 2015 rate hike, the financial commercial paper rate shown above is about 75 basis points higher, while the nonfinancial commercial paper rate is about 71 basis points higher.
What’s happened to institutional money fund yields since the Fed began hiking rates?
Institutional money fund net yields have also moved up with each of the Fed’s three rate increases. A money fund’s net yield reflects the weighted-average return on the underlying assets held by the fund, less fees charged by the fund. As described above, rates on money fund instruments such as Treasury bills and commercial paper have generally risen along with the federal funds rate, and these increases have translated into higher money fund yields. As shown in Figure 5, net yields on both prime (the solid red line) and government (the dashed black line) money funds that are held by institutional investors have increased significantly in recent quarters. In particular, the net yield on institutional prime money funds has risen about 85 basis points since mid-December 2015 and the net yield on institutional government funds rose about 55 basis points over the same period. Of course, last year’s large shift in MMF assets from prime to government MMFs described above may have affected the relative changes in these yields; for example, the substantial additions to government MMFs may have held down the yields on the underlying assets and thus the yield on government MMFs themselves.
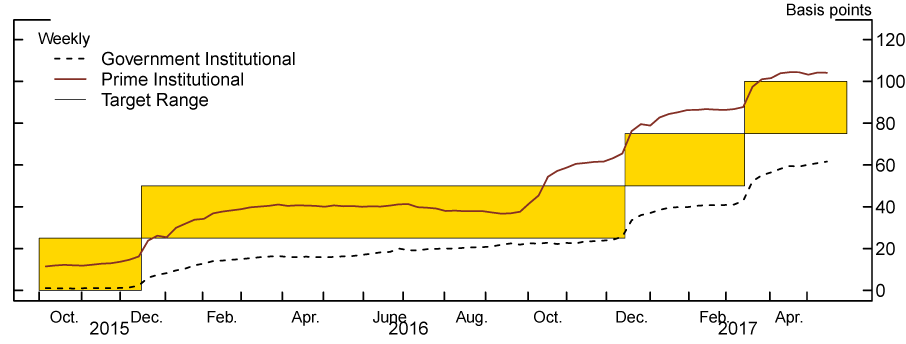
Note: The “net yields” plotted here are the asset-weighted average annualized returns, net of expense ratio, earned by investors over the past 7 days without reinvesting dividends.
Source: iMoneyNet, Money Fund Analyzer – Gold.
What’s happened to retail interest rates since the Fed began hiking rates?
So far we have focused on recent changes in wholesale interest rates; here we consider how retail interest rates have so far been affected by the Fed’s recent rate hikes. In general, in the early stages of a tightening cycle retail interest rates typically increase less than wholesale interest rates and the degree of retail rate stickiness varies substantially by type of retail product. These features are well documented in prior research on retail interest rates, notably work on banks’ deposit price setting behavior including Hannan and Berger (1991), Neumark and Sharpe (1992), Driscoll and Judson (2013), Craig and Dinger (2014), and Yankov (2014).
One possible reason for the differing behavior of pass-through to retail versus wholesale rates when short-term interest rates begin to rise is the different nature of the two types of investors. Institutional market participants, who are professional investors, adjust their investments relatively actively, in light of even small changes in returns. In contrast, retail investors, such as households, tend to exhibit significantly more inertia in adjusting their holdings of financial assets, tending not to adjust such holdings at a high frequency or to earn an additional few basis points in return. In part, the relative payoffs and costs (including time) associated with tracking such information and acting on it may help explain this differing tendency.
Recent changes in retail money fund yields demonstrate this phenomenon. In Figure 6, we plot the net yields on government and prime retail money funds which on average have higher fees—and hence lower net yields—than institutional money funds.6 As shown, net yields on both prime (the solid red line) and government (the dashed black line) money funds that are held by retail investors have increased moderately in recent quarters. In particular, the net yield on retail prime money funds has risen about 63 basis points since mid-December 2015 and the net yield on retail government funds added about 31 basis points over the same period. These increases are smaller than the ones described above for institutional money fund yields in Figure 5.

Note: The “net yields” plotted here are the asset-weighted average annualized returns, net of expense ratio, earned by investors over the past 7 days without reinvesting dividends.
Source: iMoneyNet, Money Fund Analyzer – Gold.
Moving on to retail deposit rates, Figure 7 shows simple averages of interest rates offered by commercial banks on five different types of retail deposit accounts—checking accounts, savings accounts, and 3-month, 6-month, and 1-year certificates of deposit (CDs)—in the week before the Fed’s first rate hike in December 2015 (the red striped bars) and soon after the third rate hike in an early week of April 2017 (the blue bars). Non-maturity deposits, such as checking and savings accounts, generally offer lower rates than maturity deposits, such as the three CD products considered here. As can be seen by comparing the pairs of bars, retail deposit rates of any type have not risen very much over the period since mid-December 2015. The rates on longer-maturity retail deposits have moved the most, with the rate on six month CDs having ticked up about 6 basis points over this period while the rate paid on checking accounts edged up about 1 basis point.
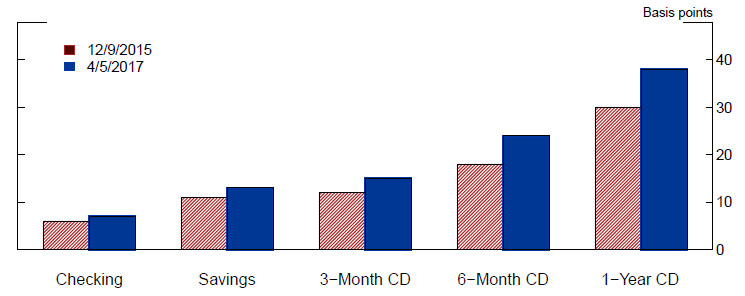
Note: The simple average of each deposit rate is the unweighted average of the various deposit products collected by RateWatch. For the checking account rate, this calculation includes interest-bearing checking accounts with $0 and $2,500 minimum balances for around 4,000 commercial banks identified by their FDIC insurance certificate number. The following deposit product types were used to construct the savings rate: money market deposit accounts with $2,500, $10,000, and $25,000 minimums; premium money market deposit accounts with $10,000 and $25,000 minimums; and savings accounts with $2,500 minimums. These rates apply to the most common deposit products offered, and so likely reflect a lower bound on the range of prevailing deposit rates. For more information on RateWatch, please see RateWatch’s Frequency Asked Questions page available here: https://www.rate-watch.com/faq.
Source: RateWatch, Deposit, Loan, and Fee Data, https://www.rate-watch.com/.
The low pass-through at this juncture is quite consistent with the last monetary policy tightening cycle, which began in 2004. At that time, the rate on checking accounts had risen 2 basis points and the rate on 6-month CDs had risen 17 basis points shortly after three, consecutive 25-basis-point Fed rate hikes (not shown). Each of these changes is substantially less than the associated 75-basis-point rise in the target federal funds. The larger increase in the 6-month CD rate after three rate hikes in the last tightening cycle versus the current tightening cycle may reflect several factors. In particular, in 2004, the economic environment was much different; at that time the Fed implemented the initial three rate hikes over a three-month period (between June 30, 2004 and September 21, 2004) and additional rate hikes of a similar pace were also anticipated by market participants. By contrast, currently, in the wake of the severe financial crisis, the Fed has implemented three rate hikes over a period of more than one year and market participants expect a much more gradual pace of additional rate hikes.
Wrap-up
Taken together, the data indicate a familiar pattern as short-term interest rates begin to rise. The Fed’s three rate hikes have largely passed through to a range of wholesale and institutional money market interest rates, while retail interest rates have so far exhibited a relatively smaller amount of rate pass-through.
References
Craig, Ben R. and Valeriya Dinger (2014). “The Duration of Bank Retail Interest Rates,” International Journal of the Economics of Business, 21(2), pp. 191-207.
Driscoll, John C. and Ruth A. Judson (2013). “Sticky Deposit Rates (PDF),” Financial and Economics Discussion Series 2013-80. Board of Governors of the Federal Reserve System.
Hannan, Timothy H. and Allen N. Berger (1991). “The Rigidity of Prices: Evidence from the Banking Industry,” The American Economic Review, 81(4), pp. 938-945.
Neumark, David and Steven A. Sharpe (1992). “Market Structure and the Nature of Price Rigidity: Evidence from the Market for Consumer Deposits,” Quarterly Journal of Economics, 107(2), pp. 657-680.
Yankov, Vladimir (2014). “In Search of a Risk-free Asset (PDF),” Financial and Economics Discussion Series 2014-108. Board of Governors of the Federal Reserve System.
* We thank Jim Clouse, John Driscoll, Ruth Judson, Brian Madigan, and Patrick McCabe of the Federal Reserve Board and Adam Biensenbach, James Egelhof, Josh Frost, Antoine Martin, John McGowan, and Will Riordan of the Federal Reserve Bank of New York for comments, and Rebecca Sansale for excellent research assistance.
1. In a previous FEDS Note (February 22, 2016), we looked at the immediate pass-through to money markets of the Fed’s first rate hike; here we consider effects over the longer period and include a few more rates. Return to text
2. Such unsecured trading also occurs in commercial paper, Treasury bill, and agency discount note markets. Return to text
3. Unsecured rates drop significantly on month-ends given a reduced demand for borrowing at such times, as foreign banking organizations (the markets’ primary borrowers) reduce the size of their balance sheets for regulatory reporting purposes. Return to text
4. Note that the calculation of the effective federal funds rate (shown in Figure 1) changed on March 1, 2016. Prior to March 1, 2016, the rate was calculated as a volume-weighted mean based on brokered data; since then, the rate is calculated as a volume-weighted median based on transactions reported in the FR 2420 Report of Selected Money Market Rates. Return to text
5. For more discussion of recent structural changes in money markets and their likely impact on the behavior of money market rates and on the implementation of monetary policy, see Simon Potter’s speech on April 5, 2017, at https://www.newyorkfed.org/newsevents/speeches/2017/pot170405. Return to text
6. The relatively higher fees associated with retail money funds generally reflect the additional cost of servicing many smaller-sized retail accounts; institutional MMFs often have minimal initial investment requirements exceeding $10 million. The relatively lower average net yields on retail MMFs also in part reflects the fact that retail funds tend to hold more deposits than institutional funds; we describe recent changes in deposit rates below. Return to text
Please cite this note as:Anderson, Alyssa, Jane Ihrig, Mary-Frances Styczynski, and Gretchen Weinbach (2017). “How Have the Fed’s Three Rate Hikes Passed Through to Selected Short-term Interest Rates?,” FEDS Notes. Washington: Board of Governors of the Federal Reserve System, June 2, 2017, https://doi.org/10.17016/2380-7172.2005.
