Was There a Great Moderation for Inflation Volatility?
Edward Hulseman and Alan Detmeister
Federal Reserve Board June 29, 2017
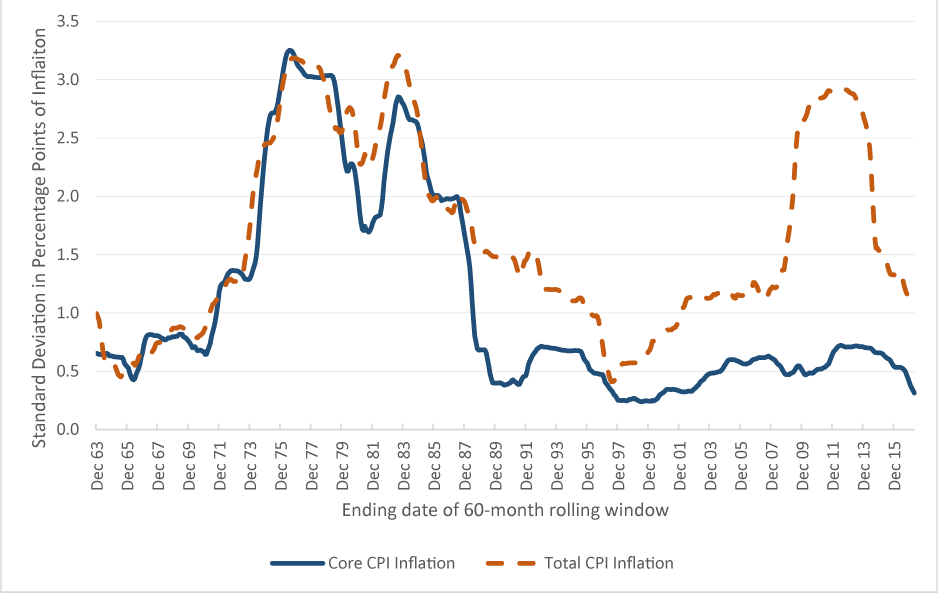
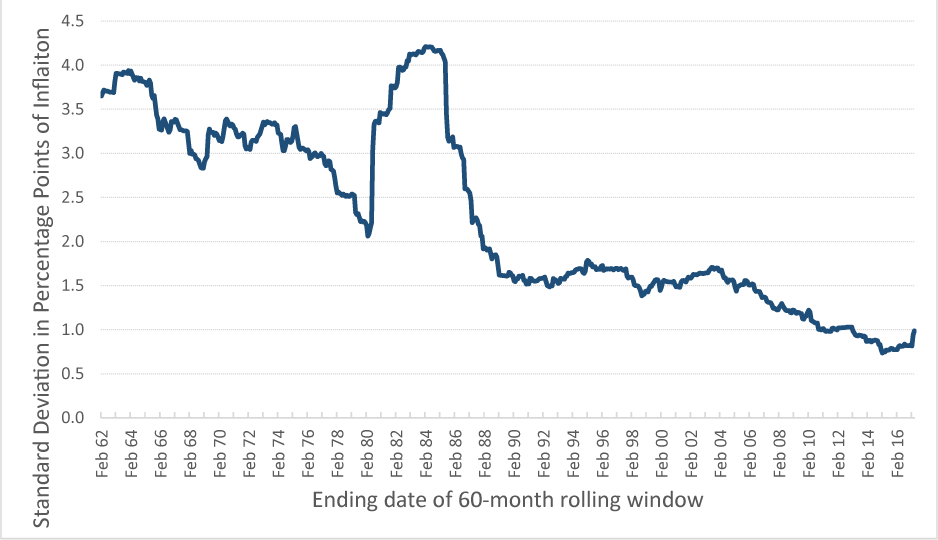
Most accounts of the “Great Moderation”–a decline in macroeconomic volatility in the decades prior to the Great Recession–focus on employment growth and GDP growth.2 Some accounts include wage and price inflation, but the inflation data fits awkwardly. Unlike employment and GDP growth in the United States–where the annual volatility in the two decades prior to the Great Recession fell noticeably below the level observed in the 1960s, and even further below the level of the 1970s–inflation’s annual volatility in US during the 1990s and early 2000s was not much different that in 1960s. (See figure 1.3) Instead, the decline in inflation volatility relative to the 1960s only occurred at frequencies shorter than a year–that is at quarterly and monthly frequencies. Abstracting from swings in inflation caused by movements in food and energy prices, which are often unrelated to macroeconomic policy, core inflation volatility at a monthly frequency has trended down notably since the 1960s. (See figure 2.4)
In this note, we demonstrate that the decline in core inflation volatility at a monthly frequency is principally an artifact of data construction. Specifically, the volatility of changes in monthly core CPI inflation since the 1960s is the by-product of changes in seasonal adjustment methodology, rebasing and rounding procedures, and the calculation of shelter inflation. After accounting for these factors the moderation in changes to monthly inflation rates largely disappears. This finding suggests caution when examining long time spans of data, and that understanding how the data is constructed is important to avoid spurious findings.
We should also be clear that we are not suggesting that the BLS has done anything wrong or inappropriate in construction the inflation indexes. Creating an index of prices that accounts for continual changes in economy and improvements in methodology–while trying to maintain a constancy with previously-published series–is a difficult, if not impossible, task, and we think the current index does quite well. In our opinion, the ability of the staff at the BLS to keep the numerous changes in methodology from having large effects on inflation is a testament to the care of the staff at the BLS.
Figure 1: Standard Deviation of Change in 12-month CPI Inflation (60-month rolling window)
Source: Bureau of Labor Statistics Consumer Price Index and authors’ calculations
Figure 2: Standard Deviation of Change in 1-month Annualized Inflation (Core CPI, 60-month rolling window)
Source: Bureau of Labor Statistics Consumer Price Index and authors’ calculations
History of the CPI and its Methodological Changes
The BLS has conducted numerous revisions in the CPI over the years to improve the methodology of the index and also to keep the basket of goods matching changing consumption patterns. Comprehensive revisions took place in 1953, 1964, 1978, 1987 and 1998 with smaller revisions at other points. When the BLS changes CPI methodology, it generally does not go back and revise previously published data.5
Table 1 lists some notable methodological changes to the CPI since 1964. This is by no means a comprehensive list, but it shows some changes that could have large impacts on the CPI and its corresponding volatility.6 Preliminary investigations, not reported here, suggested that many of the changes that we hypothesized might have affected the volatility of inflation had no clear effect. In particular, changes in the relative importance of various expenditure categories7, the expansion of the number and size of geographical regions (primary sampling units) from which prices quotes are taken8, the increase in the frequency at which some areas and items are sampled, the overall increase in the number of items sampled and number of price quotes per item, and a number of methodological changes in the 1998 revision all had no clear effect on inflation volatility. We do, however, find that changes in seasonal adjustment procedures, index number precision, and shelter methodology contributed significantly to changes in high-frequency core inflation volatility.
Table 1: Selected Methodological Changes to the CPI
| Date Implemented | Change |
|---|---|
| January 1964 | Third Comprehensive Revision
|
| January 1978 | Fourth Comprehensive Revision
|
| January 1980 | X-11-ARIMA introduced for seasonal adjustment procedures |
| January 1983 | Introduced rental equivalence for housing prices in the CPI-U |
| January 1985 | Introduced rental equivalence for CPI for Urban Wage Earners and Clerical Workers (CPI-W) |
| January 1987 | Fifth Comprehensive Revision
|
| January 1988 | Introduced adjustment procedures for age-bias of rental equivalence |
| January 1989 | Introduced direct quality adjustments for structural change in rental units |
| January 1989 | Beginning of use of intervention analysis (IASA) to improve accuracy of seasonal adjustment estimates |
| December 1997 | BLS decides not to update CPI base period to 1993-1995 and maintain 1982-1984 base period citing loss of precision |
| January 1998 | Sixth Comprehensive Revision
|
| February 1998 | Introduced X-12-ARIMA for non-intervention analysis seasonal adjustment series |
| January 1999 | Replaced arithmetic mean with geometric mean for calculating most basic components |
| January 2002 | Start of biennial weight updates. Previously weights updated only at comprehensive revisions. |
| January 2007 | Began publishing indexes to 3 decimal places. |
| January 2015 | Introduction of X-13 ARIMA-SEATS for seasonally adjusting CPI series |
Changes affecting the volatility of inflation
Seasonal Adjustment changes
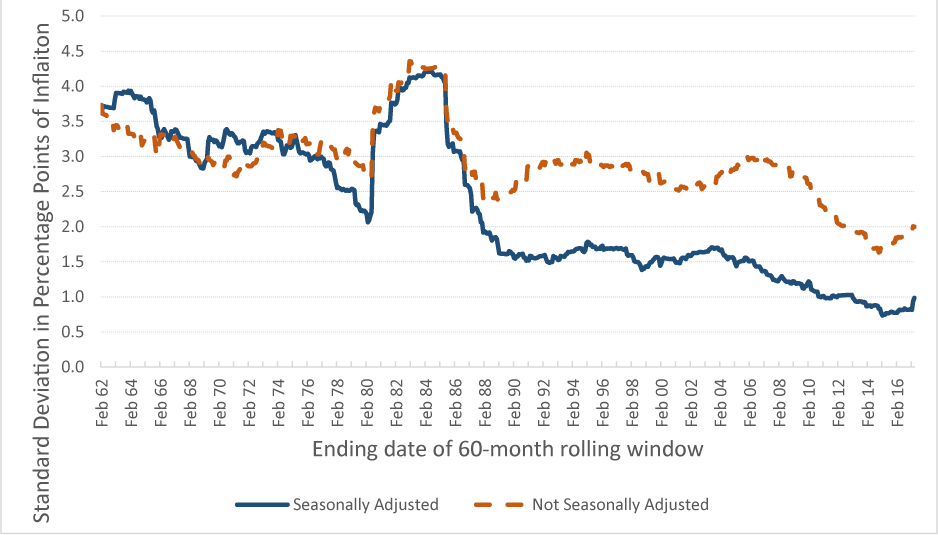
The BLS first published a seasonally adjusted index in 1966. Since that time they have continually revised their seasonal adjustment procedures. The procedures used for the data up to the late 1980s does not lower the variability of the index much. Figure 3 shows the standard deviation of the change in monthly inflation for both seasonally-adjusted and not-seasonally-adjusted core CPI inflation, and they are roughly similar prior to the late 80s. However, after that point the variablity of the seasonally-adjusted data drops well below that of the not-seasonally-adjusted series.9
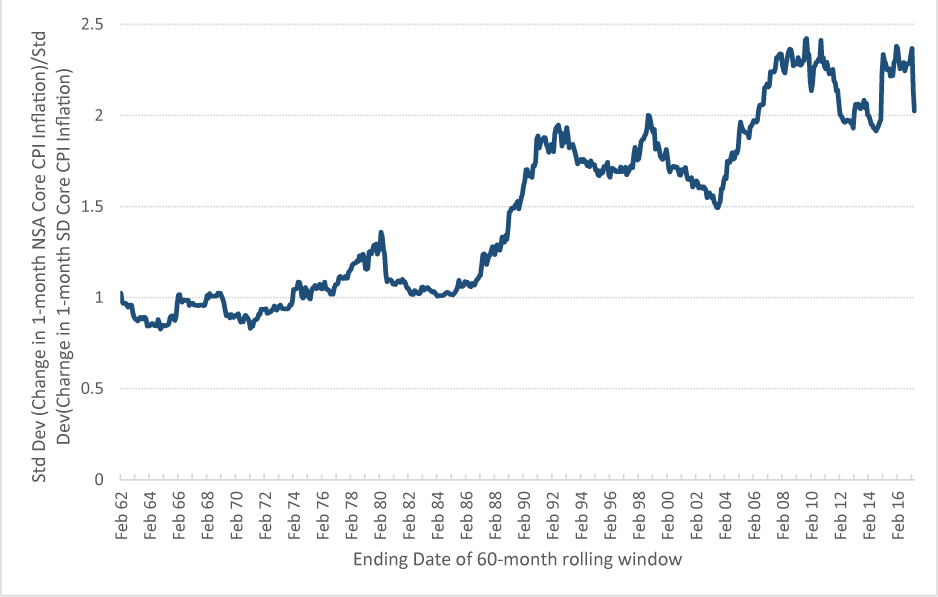
The timing of the divergence in the variability of the SA and NSA series roughly coincides with the 1989 introduction of intervention analysis for seasonal adjustment (IASA), which removes some sharp and abnormal movements in the CPI that could bias SA estimates. Given the BLS revision policy, while the actual introduction of IASA took place in 1989, the data from 1985-1989 also incorporate this change, though earlier data will not. For another view of the effect of seasonal adjustment on high-frequency inflation volatility, figure 4 shows the standard deviation of the not-seasonally-adjusted series divided by the standard deviation of the seasonally-adjusted series. This chart suggests seasonal adjustment has reduced a gradually larger share of the volatility of high frequency core inflation changes.
Figure 3: Standard Deviation of Change in 1-month Annualized Inflation (Core CPI, 60-month rolling window)
Source: Bureau of Labor Statistics Consumer Price Index and authors’ calculations
Figure 4: Ratio of Standard Deviation of NSA and SA (Changes in 1-month Core Inflation)
Source: Bureau of Labor Statistics Consumer Price Index and authors’ calculations
Change of Base
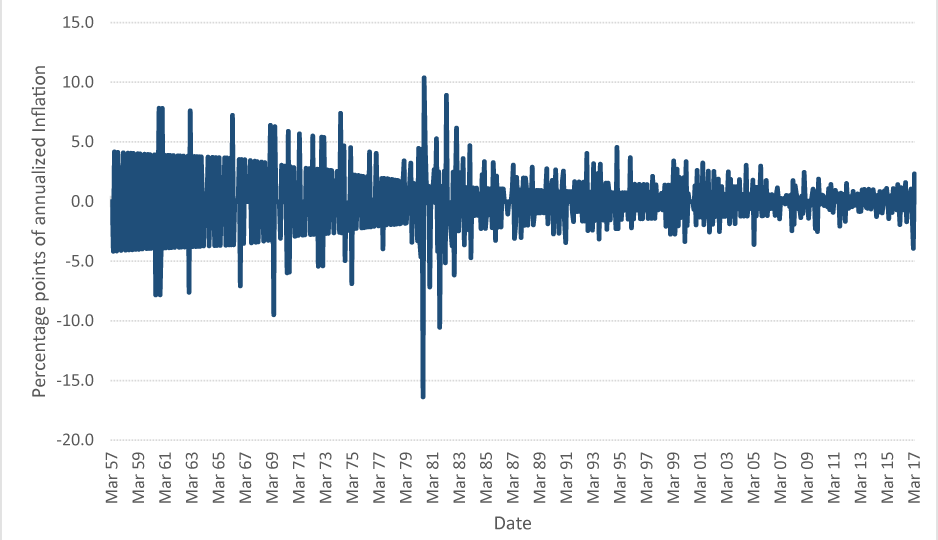
Another notable change to the CPI data was the updating of the base period to 1982-1984. Through the mid-1980s roughly every ten years the BLS updated the index level of the CPI series for the purpose of having a more current base year.10 Rebasing an index is a common procedure and, in and of itself, is not a cause of bias. The problem occurred in that the BLS also rounded the index value to just one decimal place until 2007. Since the inflation rate is calculated as a percent change, historical values that have smaller index numbers will be greatly affected by this rounding. Recent data, which have larger index values, will be less affected. Kozicki and Hoffman (2004) noted this problem and its effect on the volatility of historical data. The problem can be observed by taking the current core CPI series and plotting the size of changes to 1-month inflation rates, as shown in figure 5. For the late-1950s data the smallest unit of change in the index amounted to a swing in the annualized inflation rate of four percentage points. For the early 1980s data the smallest unit of change in the index is roughly one-third that size. In 2007 the BLS began publishing new CPI data to 3 decimal places, which has effectively eliminated any problems with the base effect, but they have not released pre-2007 data at the higher level of precision.
Figure 5: Change in 1-month Core inflation rate from prior month (current 1982-1984 base)
Source: Bureau of Labor Statistics Consumer Price Index and authors’ calculations
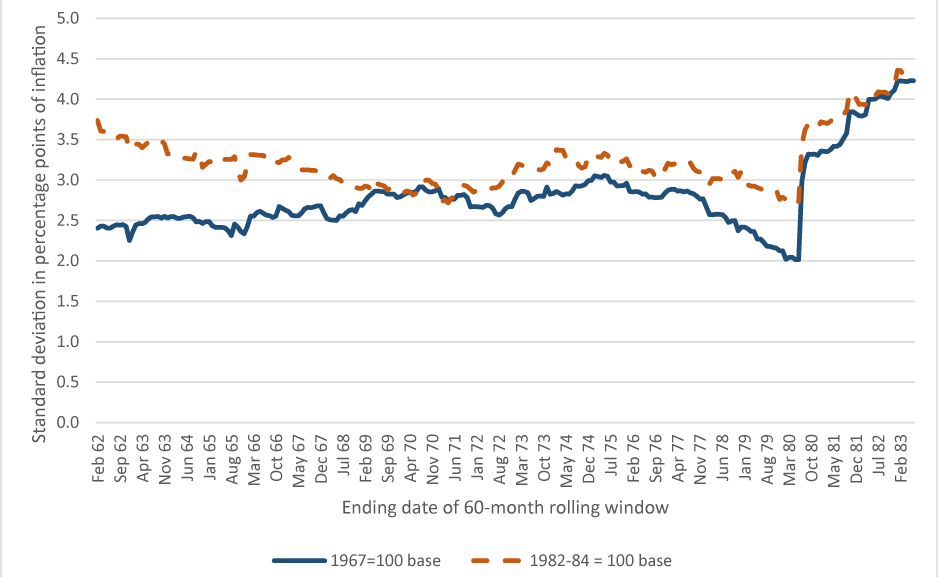
Figure 6 compares the volatility using the 1982-84 base years with data using the 1967 base year obtained from the BLS. The 1982-1984 base year has persistently higher volatility than the 1967 base year in the early years of the sample. Over time the difference between the series becomes smaller as the rounding error becomes minimal. The variances for the 1967 and 1982-1984 base years appear to converge around 1982.11
Figure 6: Standard Deviation of Change in 1-month Core CPI inflation for different base dates
Source: Bureau of Labor Statistics Consumer Price Index and authors’ calculations
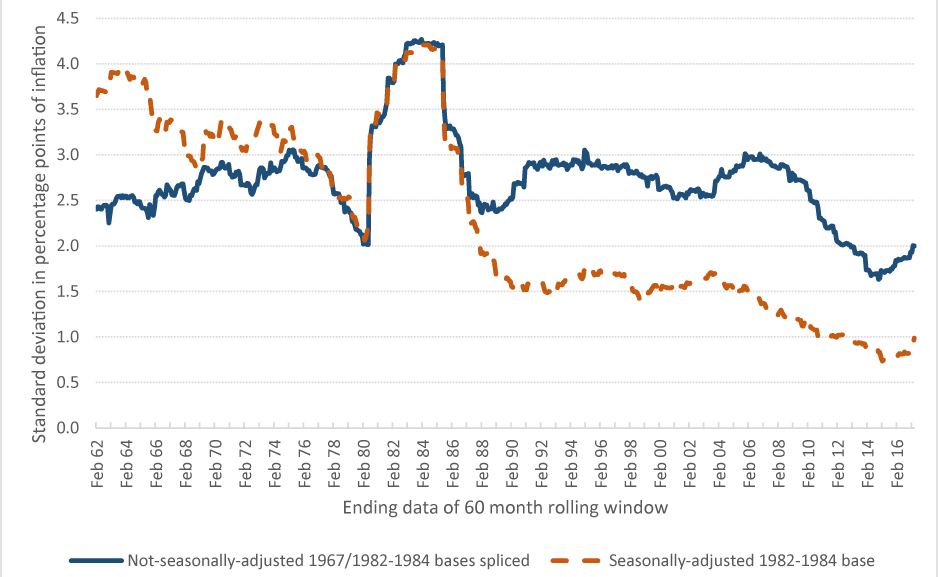
Taking into account the effects of changes in both seasonal-adjustment procedures and change-of-base greatly reduces the decline in the in the volatility of monthly core CPI bias inflation. The blue solid line in figure 7 plots the standard deviation of changes to one-month inflation using not-seasonally-adjusted, 1967 base year until June of 1983 and the not-seasonally-adjusted, 1982-1984 base year after that dates. This series shows that, outside of a spike in the early 1980s and a dip in recent years, the volatility of changes in monthly core CPI inflation has been fairly constant, and certainly does not show evidence for a Great Moderation. In comparison, the standard deviation of the more commonly used seasonally-adjusted 1982-1984 base series, the orange dashed line in figure 7, which was also shown in figure 2, displays a much more pronounced downtrend since the early 1960s.
Figure 7: Effect of seasonal adjustment and index base on standard deviation of change in 1-month core CPI inflation
Source: Bureau of Labor Statistics Consumer Price Index and authors’ calculations
Housing Adjustments
While the effects of the base year and seasonal adjustment can account for most of the decline in the volatility of monthly core CPI inflation, there are still some changes in volatility over time that are unaccounted for—most notably a run-up and then decline in the early-1980s and a fall since 2007. These movements could simply reflect higher inflation leading to more volatile inflation. However, the timing does not line up well for this explanation: A five year moving average of inflation (not shown) rises throughout the 1970s and peaks in 1981. In contrast, the five year moving average of volatility in figure 7 does not rise in the late 1970s and the peak volatility occurs from 1983 to 1985.
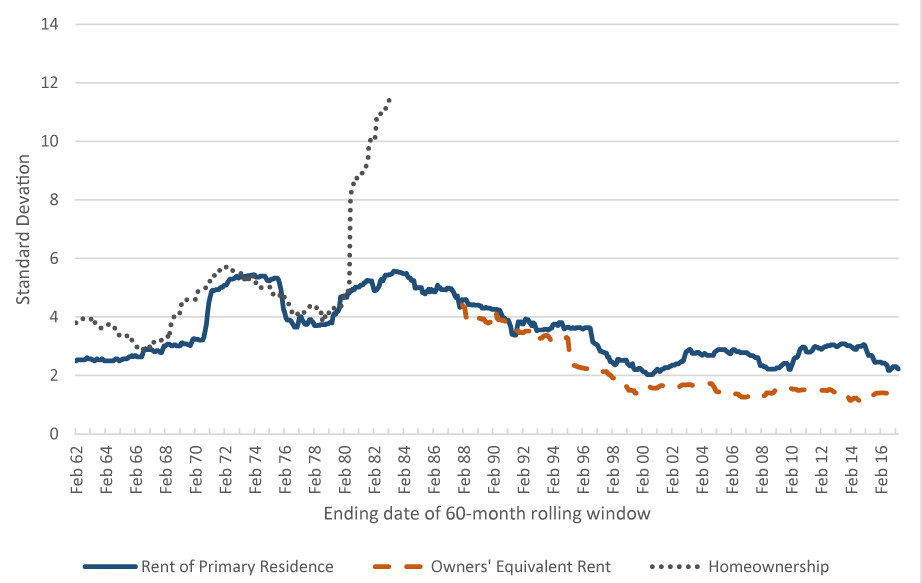
Instead, we note that in 1983 the BLS implemented a significant change to the measurement of costs for home owners–a cost which currently accounts for roughly one-quarter of CPI expenditures. Prior to 1983 shelter costs for home owners was based on home purchase costs, mortgage costs, taxes, insurance and repair costs. This series, the dotted grey homeownership line in figure 8, showed a significant spike in volatility in the early 1980s, driven by increases in home mortgage rates. Since 1983 shelter costs for home owners has been based on expected rental rates if a home owner were to rent out their home, a concept called owners’ equivalent rent. The change in the measurement of housing costs occurred to separate the investment component of house prices from the part devoted to renting a place to provide shelter.
The volatility of rent prices for tenants, the solid blue rent of primary residence line in figure 8, did not spike up in the early 1980s, and the volatility of the owners’ equivalent rent series, the orange dashed line, has largely tracked the volatility of rent prices for tenants over the period for which the two series are available. As a result it is likely that if the owners’ equivalent rent concept were in place for measuring shelter costs for home owners prior to 1983 that series also would not have seen the rise that occurred in homeownership prices.12
Figure 8: Volatility of Rent, OER, and Homeownership Inflation in the CPI
Source: Bureau of Labor Statistics Consumer Price Index and authors’ calculations
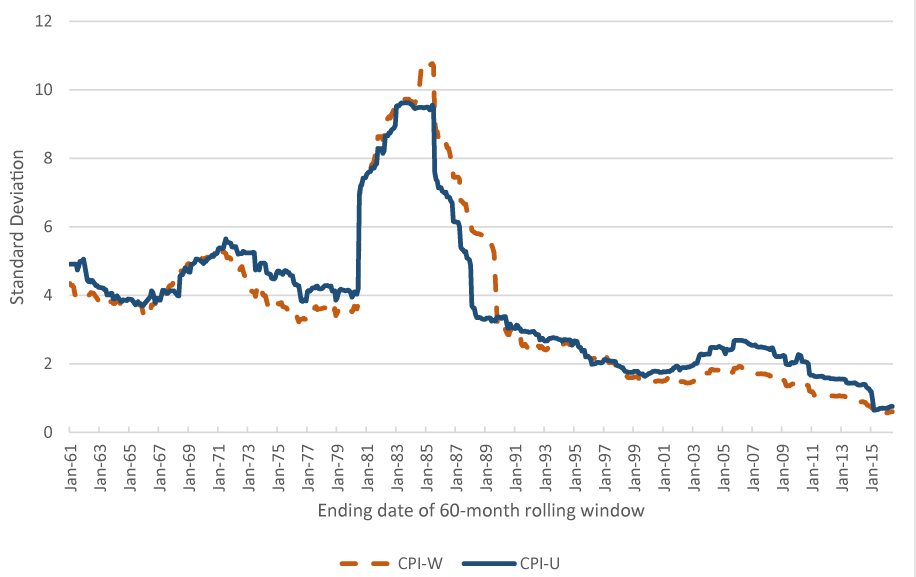
Also suggesting that the change of methodology in housing prices would have moderated the 1980s spike in volatility is a timing difference between the CPI-U (CPI for All urban consumers, the most commonly used CPI) and the CPI-W (CPI for urban wage earners and clerical workers). The move to owners’ equivalent rent occurred two years earlier in the CPI-U than in the CPI-W. Figure 9 shows the standard deviation of 1-month changes to shelter inflation in the CPI-U, the solid blue line, increased up until the introduction of the rental equivalence in 1983 before declining. Around January 1988, the end of the 5-year rolling window that we use for analysis, the volatility has fallen back down to a level consistent with its level prior to the spike. For the CPI-W the volatility of shelter inflation fell two years later than in the than in the CPI-U rental equivalence, as one might expect if the introduction of rental equivalence reduced volatility.13
Figure 9: Effect of Introduction of Owners’ Equivalent Rent on Volatility of Changes in Shelter Inflation in CPI-U and CPI-W
Source: Bureau of Labor Statistics Consumer Price Index and authors’ calculations
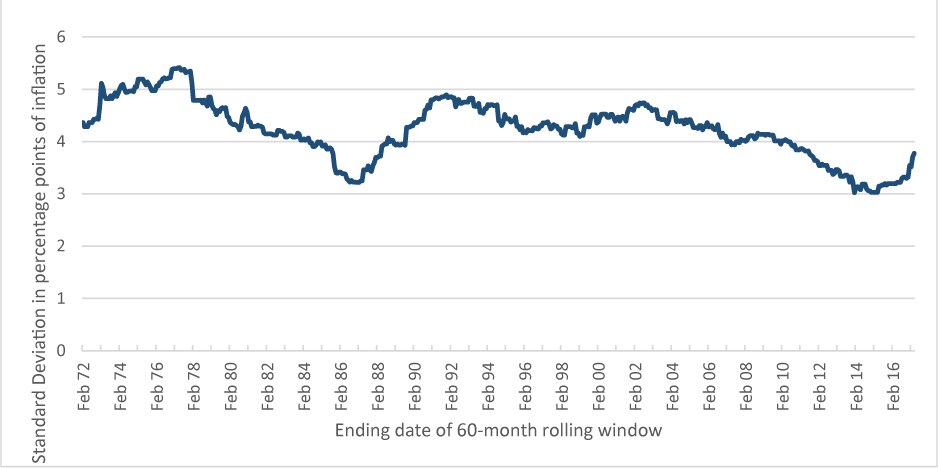
Finally, looking at the effect of changes in the measurement of shelter on the overall index, figure 10 shows the volatility of changes in inflation for the CPI excluding food, energy, and shelter. We note that this index does not have the pronounced run-up in the early 1980s seen in figure 7 in the volatility of changes to overall core inflation. The lack of the early-1980s run-up suggests that shelter, and changes to how that component is measured, played a key role in the volatility of inflation over that period.14
Figure 10: Standard Deviation of Change in 1-month Annualized Inflation (Core CPI excluding shelter, 60-month rolling window)
Source: Bureau of Labor Statistics Consumer Price Index and authors’ calculations
Conclusion
Overall we find that much of the decline in the volatility of changes in monthly core inflation since the 1960s is a result of changes in seasonal adjustment techniques and rebasing. Accounting for this there is little long-run trend in the series and no evidence of a Great Moderation in inflation volatility at a monthly frequency. We even find evidence that much of the run-up and decline in the volatility of the series in the early 1980s was due to the measurement of shelter and the change to owners’ equivalent rent. These findings suggest that measurement issues are important to consider when looking at long-run trends in economic data.
References
Bernanke, Ben, 2004. “The Great Moderation.” Speech at the meetings of the Eastern Economic Association, Washington, D.C., February 20.
Blanchard, O. and Simon J. , 2001 . “The Long and Large Decline in the US Output Volatility.” Brookings Papers on Economic Activity. 32(1)., 134-174.
Clarida, Richard, Jordi Gali, and Mark Gertler, 2000. “Monetary Policy Rules and Macroeconomic Stability: Evidence and Some Theory,” Quarterly Journal of Economics, 115, pp. 147-80
Kahn, James A., Margaret McConnell, and Gabriel Perez-Quiros, 2002. “On the Causes of the Increased Stability of the U.S. Economy, ” Federal Reserve Bank of New York, Economic Policy Review, 8, pp. 183-202.
Kim, C.L. and Nelson C.R., 1999. “Has the US Economy Become More Stable? A Bayesian Approach Based On A Markov-Switching Model of the Business Cycle.” The Review of Economics and Statistics, 81(4), 608-616.
Kozicki, S., & Hoffman, B., 2004. Rounding Error: A Distorting Influence on Index Data. Journal of Money, Credit and Banking,36(3), 319-338.
McConnell, Margaret, and Gabriel Perez-Quiros, 2000. “Output Fluctuations in the United States: What Has Changed since the Early 1980s?” American Economic Review, 90, pp. 1464-76.
Stock, James H. and Mark W. Watson, 2002, “Has the Business Cycle Changed and Why?” in Mark Gertler and Kenneth Rogoff, eds., NBER Macroeconomics Annual 2002. Cambridge, MA: MIT Press, 159-218.
Stock, James H. and Mark W. Watson, 2007. “Why has US Inflation become harder to forecast?” Journal of Money, Credit and Banking. February.
Wolman, Alexander L. and Ding, Fan, (2005) “Inflation and Changing Expenditure Shares” FRB Richmond Economic Quarterly, vol. 91, no. 1, Winter 2005, pp. 1-20.
1. Edward Hulseman is a recent graduate of Appalachian State University. He contributed to the research for this Note when he was an intern at the Board of Governors in the summer of 2016. Return to text
2. Key articles in the Great Moderation literature include Kim and Nelson (1999), McConnell and Perez-Quiros (2000), Blanchard and Simon (2001), Stock and Watson (2002), and Bernanke (2004). Return to text
3. This note uses the standard deviation of the change in the inflation rate as the measure of volatility. Focusing on volatility of changes to inflation, rather than the volatility of the inflation rate itself, reduces the effect of a decline (or increase) in the long-run trend level of inflation on the measure. The standard deviation of the change in inflation can be thought of as roughly equivalent to the volatility of inflation around its trend, a key component in Stock and Watson’s (2007) UC-SV model and similar models that decompose inflation into permanent and transitory components. However, most of the analysis holds through if we were to look at the volatility of the level of inflation. Return to text
4. Stock and Watson (2002) and Bernanke (2004) noted the decline in the volatility of quarterly inflation, and Stock and Watson (2007) show a decline in both the volatility of changes to trend inflation and the volatility of observed inflation around its trend using quarterly data. Return to text
5. There are some exceptions: Current policies revise seasonal factors for the seasonally-adjusted CPI up to five years back. Also, the BLS has created research series which attempt to adjust the growth rate of the CPI for the effects of some major methodological changes. Return to text
6. For an expanded and more detailed list of methodological changes through the CPIs history see The BLS Handbook of Methods Chapter 17 and The Timeline of Seasonal Adjustment Methodological Changes.Return to text
7. Wolman and Ding (2005) also looked at how changing expenditure shares may affect the CPI index and its volatility. They used very broad categories, using services, durables and nondurables. We looked at disaggregated PCE price index categories and found that changes in expenditure share had little effect on core inflation volatility. Return to text
8. A primary sampling unit (PSU) is the smallest geographic classification for the BLS. Since the 1960s, many of the PSUs have become much broader. For example, in 1978, the New York PSU included 18 counties and boroughs across New York, New Jersey and Connecticut. Currently, the NY PSU includes 29 counties and boroughs and even expands into Pennsylvania. Return to text
9. As our analysis uses a 60-month trailing moving average any methodological changes introduced at a given point will slowly be incorporated into the volatility over a five-year period. Return to text
10. A rebase was initially planned in the late-1990s, but, citing an issue with biasing historical data, the BLS opted against a rebasing. For more information on the Bureau of Labor Statistics decision to not rebase their data see the BLS Detailed Report from December, 1997 titled, BLS to Maintain Current reference Base of 1982-1984=100 for Most CPI Index Series.Return to text
11. We could go a step further and only allow changes over the full sample that conform with the percentage increment that occurred at the start of the sample. (This forces monthly changes to have the same loss of precision as occurred in the worst period.) We find this extra step has no real effect on the volatility of the index when we have data using the 1967 base, and so do not show the results here. We do, however, use this procedure in the next section of this note when we were unable to get series that use the 1967 base. Return to text
12. There is a gap between the end of the homeownership series in figure 9 and the start of the owner equivalent rent series as a result of using 60-month rolling windows of the analysis of the volatility. When constructing figures 8 and 10 not-seasonally-adjusted data was used. However, we do not have multiple base years for the series. To overcome the base index problem the procedure mentioned in footnote 9 was use, which for each series restricted changes in the index number to increments of the same percentage over the entire time span of the data. Return to text
13. These are constructed using seasonally-adjusted current 1982-1984 base data. Return to text
14. Unfortunately we were not able to obtain data for data for this series prior to 1972. Return to text
Please cite this note as:Detmeister, Alan, and Edward Hulseman (2017). “Was There a Great Moderation for Inflation Volatility?,” FEDS Notes. Washington: Board of Governors of the Federal Reserve System, June 29, 2017, https://doi.org/10.17016/2380-7172.2011.
Disclaimer: FEDS Notes are articles in which Board economists offer their own views and present analysis on a range of topics in economics and finance. These articles are shorter and less technically oriented than FEDS Working Papers.

